
The Manual Tax
Enterprise AI is stalling because leaders bought tools without subtracting work. The receipts on the pilot-to-P&L gap, the executive-worker split, and why enablement becomes the change management owner.
The short answer
What does the research show about The Manual Tax?
Evidence
- Reps spent 63% of their time on non-selling work in 2014 and about 60% in 2026 per Salesforce State of Sales. The tool count rose. The tax barely moved.
- Workers lose the equivalent of 51 working days a year to technology friction, up 42% from 2025, per WalkMe's State of Digital Adoption 2026.
- 33% of workers have not used AI at all and 54% bypassed their company's AI tools in the last 30 days. Combined, roughly eight in ten are avoiding or working around it.
Supporting pages
- Dictionary plain-language definitions
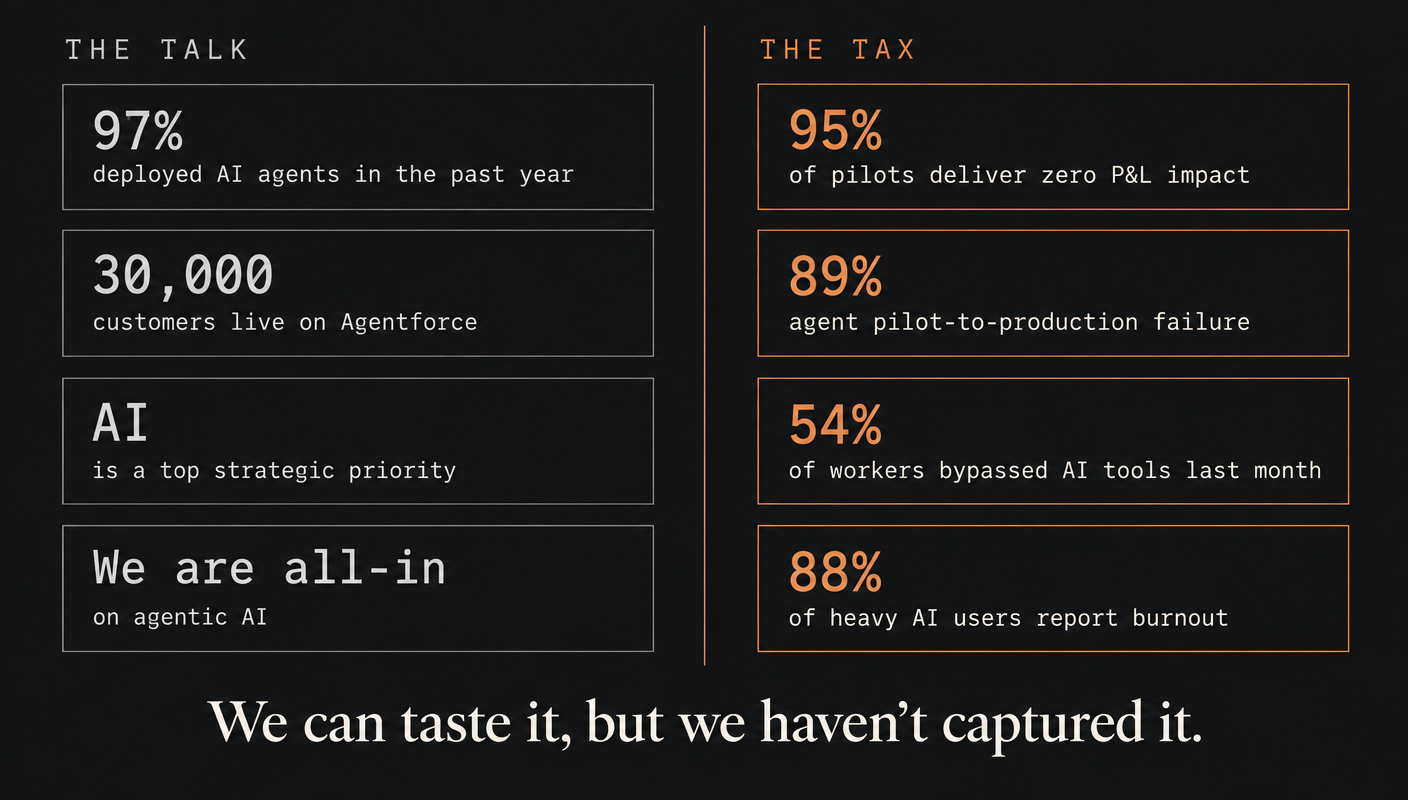
Dreamforce 2026 was the biggest production the category has staged. AIforce, Koa, Agentforce, Slackforce, and Claudeforce were on every wall, and Salesforce said 30,000 customers were live on Agentforce. In the hallways, the people carrying the AI mandate for their companies were tired. The sentence that travelled furthest afterwards was the one repeated behind closed doors: we can taste it, but we haven't captured it.
That sentiment is not one recap. It is the analyst, media, and worker-survey consensus in September 2026. MIT's NANDA initiative found 95% of generative AI pilots delivered no measurable P&L impact. Writer's 2026 adoption survey found 97% of companies deployed AI agents in the last twelve months and 29% see significant return. WalkMe's State of Digital Adoption, reported by Fortune found 54% of workers bypassed their company's AI tools in the last 30 days and did the work by hand.
The mechanism behind those numbers is not model quality. It is that AI was added on top of the work instead of taking work away. Harvard Business Review's 2026 study of 1,488 US workers recorded the cost of that addition directly: 88% of heavy AI users report increased burnout, and self-reported productivity falls once a worker is running more than three AI tools. Forbes named the sequencing error precisely, describing companies that push usage before trust, productivity before clarity, and automation before a thoughtful redesign of work.
This page measures the tax, shows the two rollout patterns that produce opposite outcomes, and sets out the operating loop and the 90-day plan an enablement leader can take into a QBR. Related reading sits in The Proof Gap and The Reversal Ledger.
What this page is
A measurement of the administrative work that stays on a revenue team after it buys AI, and a read on why the programs that produce receipts subtract work before they add tools.
The argument
Enterprise AI is stalling because the tool arrived without the conditions it needed to work. Data hygiene, workflow redesign, coaching cadence, adoption measurement, and behavior change are those conditions, and they are the enablement charter. That is why enablement becomes the change management owner in 2026.
How to read it
- The bars on the pilot-to-P&L chart come from four different publishers and four different samples. Read the shape of the drop, not the arithmetic between any two bars.
- The executive-worker gap is self-reported on both sides. Executives are answering about the organization and workers are answering about their own day, which is part of the finding rather than a flaw in it.
- The Manual Tax ledger is an illustrative model built by this publication, not a measured average. Use it to size your own activity audit, then replace every number with your own.
- Two case studies are not a rule. Klarna and the wellness-brand engineering org show that rollout mechanism separated the outcomes in those two cases.
The talk and the tax, measured in the same year.
Left column is what the market said in 2026. Right column is what the published research recorded in the same twelve months.
The talk
Companies that deployed AI agents in the last 12 months
97%
Writer 2026
Customers Salesforce says are live on Agentforce
30,000
Dreamforce 2026
Executives who say AI is a top strategic priority
Near universal
Writer 2026
Executives who say their AI strategy is more for show than guidance
75%
Writer 2026
The tax
Generative AI pilots with no measurable P&L impact
95%
MIT NANDA
Agent pilots that fail to reach production
89%
Deloitte 2026
Workers who bypassed company AI tools in the last 30 days
54%
WalkMe 2026
Heavy AI users reporting increased burnout
88%
HBR 2026
The difference between the two columns is work that never came off anyone's plate.
What this does not say
This does not show that AI produces no value anywhere. It shows the distance between announced deployment and measured return.
- Publisher
- Compiled by The Revenue AI Report from five published sources
- Sample and method
- MIT NANDA 2025, Deloitte 2026 Tech Trends, WalkMe State of Digital Adoption 2026, Harvard Business Review 2026, Writer AI Adoption Survey 2026
- Field dates
- Fetched September 2026
Five publishers, five different samples. The columns are not two measurements of one population.
78% have a pilot. 14% have scaled one. 5% can show a P&L line.
Each bar is a separate published measurement of the same journey, not one cohort followed through five stages.
Share of enterprises at this stage
- Enterprises with an AI agent pilot running78%
Teradata survey, 2026
pilots above this line, production and return below it - Enterprises with at least one agent scaled org-wide14%
Teradata survey, 2026
- Companies reporting significant ROI from AI29%
Writer 2026, asked of all deployers
- Generative AI initiatives with measurable P&L impact5%
MIT NANDA, 2025
- Companies McKinsey counts as scaling beyond pilot5%
McKinsey via Softchoice
Top to bottom spread: 64 points
What this does not say
This is not a funnel of one cohort. No publisher tracked the same companies from pilot through to P&L.
- Publisher
- Teradata 2026, Writer 2026, MIT NANDA 2025, McKinsey via Softchoice
- Sample and method
- Four publishers, four independent samples, all fetched September 2026
- Field dates
- Not published by the source.
Different samples and different definitions of return. Read the shape, not the arithmetic between bars.
Each bar is a separate published measurement of the same journey, not one cohort followed through five stages.
| Share of enterprises at this stage | Value (%) | Note |
|---|---|---|
| Enterprises with an AI agent pilot running | 78 | Teradata survey, 2026 |
| Enterprises with at least one agent scaled org-wide | 14 | Teradata survey, 2026 |
| Companies reporting significant ROI from AI | 29 | Writer 2026, asked of all deployers |
| Generative AI initiatives with measurable P&L impact | 5 | MIT NANDA, 2025 |
| Companies McKinsey counts as scaling beyond pilot | 5 | McKinsey via Softchoice |
Source: Teradata 2026, Writer 2026, MIT NANDA 2025, McKinsey via Softchoice. Four publishers, four independent samples, all fetched September 2026 Confidence: Medium.
Caveat: Different samples and different definitions of return. Read the shape, not the arithmetic between bars.
What this does not say: This is not a funnel of one cohort. No publisher tracked the same companies from pilot through to P&L.
Executives and workers are describing different companies.
Each row is one statement put to both groups. The distance is the gap in percentage points.
- Workers embrace AI adoption-70 pts
90% → 20%
- Employees have adequate AI tools-67 pts
88% → 21%
- AI improves workplace efficiency-65 pts
77% → 12%
- AI can be trusted for complex, business-critical decisions-52 pts
61% → 9%
What this does not say
A 67-point gap does not prove the tools are bad. It shows the two groups are not measuring the same thing.
- Publisher
- WalkMe, State of Digital Adoption 2026, reported by Fortune
- Sample and method
- Executive and worker samples reported side by side, April 9, 2026
- Field dates
- Not published by the source.
Self-reported on both sides. Executives answer about the organization, workers answer about their own day.
Five in every hundred generative AI pilots produced a measurable P&L line.
Each square is one pilot in a hundred. Filled squares reached a measurable business result.
95 of every 100 pilots studied produced no measurable profit and loss impact.
What this does not say
This does not say 95% of AI projects were abandoned. It says their return was never demonstrated on the P&L.
- Publisher
- MIT NANDA, State of AI in Business 2025, reported by Fortune
- Sample and method
- Study of enterprise generative AI pilots, published August 18, 2025
- Field dates
- Not published by the source.
Measurable P&L impact is a strict bar. Pilots with unmeasured or indirect value count as failures here.
Managers see efficiency. Heavy users report burnout.
Two figures from the same 2026 study of 1,488 US workers.
77%
Managers who believe AI improves efficiency
88%
Heavy AI users reporting increased burnout
Same study, opposite direction
What this does not say
This does not show AI causes burnout. It shows the people using AI most are the people reporting the most strain.
- Publisher
- Harvard Business Review, 2026, reported by Help Net Security and TechCrunch
- Sample and method
- n=1,488 US workers. Heavy oversight associated with 14% more mental effort, 12% greater fatigue, 19% greater information overload
- Field dates
- Not published by the source.
Burnout is self-reported and the study is cross-sectional, so causation is not established.
Six repeating failure modes in top-down AI mandates.
Each row is a pattern with a published figure or a first-party admission behind it.
Mandate without redesign
Organizations still applying AI to existing workflows rather than rethinking how the work gets done. MTLC 2026.
63%
Medium confidence
Cost cutting as the only lens
Klarna's CEO: cost unfortunately seems to have been a too predominant evaluation factor. What you end up having is lower quality.
First-party admission
High confidence
Usage as a KPI
Forbes: when employees feel measured by how much AI they use rather than how intelligently they use it, incentives quickly become distorted.
Mechanism
Medium confidence
Layoff-first framing
Gartner expects 30% of employees laid off because of AI to be rehired by 2029, often at higher cost.
30% by 2029
Medium confidence
Tool sprawl
Self-reported productivity falls once a worker runs four or more AI tools, in a 2026 study of 1,488 workers.
3 tools
Medium confidence
No named owner in production
Deloitte and Teradata point at the same absent seat: someone accountable when the agent makes a wrong call at 2am.
Missing role
Low confidence
What this does not say
The six are not mutually exclusive, and no publisher has measured which one costs the most.
- Publisher
- MTLC 2026, Klarna via Transformation Playbook, Forbes June 2026, Gartner via Inc., HBR 2026
- Sample and method
- Five publishers, compiled September 2026
- Field dates
- Not published by the source.
These are patterns observed across published cases, not a controlled ranking of failure causes.
Two rollout patterns, opposite outcomes, same technology.
Top lane is the mandate-and-cut pattern. Bottom lane is the diagnose, embed, and measure pattern.
Mandate and cut: Klarna
Company-wide deploymentFeb 2024
AI assistant reported handling 2.3 million chats in a month, described as the work of 700 agents
Headcount falls2024
Staff reduced from roughly 5,000 to roughly 3,500
Quality complaints2024
Complex disputes, distressed customers, and multi-step problems fell through the gaps
Public reversalMay 2025
CEO tells Bloomberg the company went too far and starts rehiring humans
Diagnose, embed, measure: global wellness brand engineering org
BaselineWeek 0
Near zero AI adoption. Three engineers embedded as an engineering engagement, not a training program
AuditWeeks 1 to 2
Existing tooling, workflows, and team appetite diagnosed before any stack was selected
Wave oneWeeks 2 to 3
Six-person core team, hands-on pairing
Wave twoWeeks 3 to 4
Eleven-person dev team, adoption metrics wired into team OKRs
Full orgWeeks 5 to 6
All 38 engineers. PR velocity up 40%, 13 outside contractors offboarded
What this does not say
Two cases do not establish a rule. They show that rollout mechanism, not model choice, separated the outcomes here.
- Publisher
- Forbes May 2025 and Transformation Playbook April 2026 for Klarna; Check + Pluris case study 2026 for the engineering org · Vendor research
- Sample and method
- Two published cases, different industries and different sizes
- Field dates
- Not published by the source.
The engineering case is a vendor-published case study. The outcome figures are the vendor's own.
Where the Manual Tax sits, hour by hour, in an illustrative rep week.
Hours reclaimed per rep per week if each task is eliminated rather than assisted. This is a model, not a measurement.
Hours reclaimed per rep per week
- CRM data entry5.5hrs
6.0 hrs before, 0.5 after
- Meeting prep and research4hrs
5.0 hrs before, 1.0 after
- Follow-up email drafting3.5hrs
4.0 hrs before, 0.5 after
- Post-call notes3.3hrs
3.5 hrs before, 0.2 after
- Pipeline hygiene2.2hrs
2.5 hrs before, 0.3 after
- Forecast prep1.6hrs
2.0 hrs before, 0.4 after
Top to bottom spread: 20.1 hrs per rep per week
What this does not say
These are not measured hours from any survey. Individual results will vary by segment, motion, and CRM hygiene.
- Publisher
- The Revenue AI Report, illustrative model
- Sample and method
- Task list from Salesforce State of Sales 2026 (reps spend about 60% of time on non-selling tasks) and Accordion 2025 (conversational CRM reducing sales admin work 60% to 80%)
- Field dates
- Modelled September 2026
Illustrative. The hour splits are a model for sizing a baseline, not a measured average. Run your own activity audit before quoting any number.
Hours reclaimed per rep per week if each task is eliminated rather than assisted. This is a model, not a measurement.
| Hours reclaimed per rep per week | Value (hrs) | Note |
|---|---|---|
| CRM data entry | 5.5 | 6.0 hrs before, 0.5 after |
| Meeting prep and research | 4 | 5.0 hrs before, 1.0 after |
| Follow-up email drafting | 3.5 | 4.0 hrs before, 0.5 after |
| Post-call notes | 3.3 | 3.5 hrs before, 0.2 after |
| Pipeline hygiene | 2.2 | 2.5 hrs before, 0.3 after |
| Forecast prep | 1.6 | 2.0 hrs before, 0.4 after |
Source: The Revenue AI Report, illustrative model. Task list from Salesforce State of Sales 2026 (reps spend about 60% of time on non-selling tasks) and Accordion 2025 (conversational CRM reducing sales admin work 60% to 80%) Fielded Modelled September 2026. Confidence: Low.
Caveat: Illustrative. The hour splits are a model for sizing a baseline, not a measured average. Run your own activity audit before quoting any number.
What this does not say: These are not measured hours from any survey. Individual results will vary by segment, motion, and CRM hygiene.
The enablement operating loop: five moves that turn AI capacity into behavior change.
Skip a node and the pilot stalls at the node before it.
01 · 01
Diagnose
AI now scores close to every call and demo rather than the two or three a manager had time to sample. Signal arrives at scale.
https://braintrustgrowth.com/9-ways-ai-is-actually-changing-sales-enablement-in-2026/
02 · 02
Redesign
For every capability introduced, name what stops being manual work. If nothing stops, the deployment fails.
https://www.mtlc.co/2026-ai-in-revenue-enablement-report-trends-insights/
03 · 03
Coach
Identifying the gap and closing the gap are two different jobs. Managers close them on a weekly cadence enablement designs and enforces.
https://braintrustgrowth.com/9-ways-ai-is-actually-changing-sales-enablement-in-2026/
04 · 04
Measure
Hours reclaimed, cycle time, ramp time, win rate. Not licenses activated and not dashboard usage.
https://www.forbes.com/sites/kathycaprino/2026/06/26/why-ai-adoption-is-failing-inside-many-companies/
05 · 05
Prove
Before-and-after evidence signed by RevOps unlocks the next wave. Without it the budget is cut in the next planning cycle.
https://checkpluris.com/case-study/a-global-wellness-brand-lifted-pr-velocity-40-in-6-weeks
What this does not say
Running the loop does not guarantee a return. It removes the failure modes recorded in the cases above.
- Publisher
- Forrester February 2026, Braintrust September 2026, Check + Pluris 2026, CI&T June 2026
- Sample and method
- Loop compiled by The Revenue AI Report from four published sources
- Field dates
- Not published by the source.
This is a framework, not a measured process. No publisher has tested the five nodes as a controlled sequence.
The 90-day receipts-first playbook, phase by phase.
Four phases, each with a definition of done an enablement leader can be held to.
Days 1 to 14: measure the Manual Tax
Activity auditWeek 1
One-week audit on three to five reps using calendar data, CRM activity logs, and email metadata. Categorize every minute
Baseline publishedWeek 2
Selling time as a share of total time, plus hours per week on CRM admin, meeting prep, forwarded threads, and forecast prep
Definition of doneDay 14
A dollar figure named for the current Manual Tax, and the top three tasks reps would pay to eliminate
Days 15 to 45: design the subtraction
Capability mappingWeek 3
For each of the top three tasks, name the capability that eliminates it. Not augments. Eliminates
Wave one selectedWeek 4
Five to eight reps. No company-wide rollout
Accountability setWeek 6
Adoption wired into team OKRs, weekly manager coaching cadence set, an operational owner named for every agent going into production
Definition of doneDay 45
Wave one launched with named accountability
Days 46 to 75: run the wave, measure the receipts
Weekly measurementWeeks 7 to 10
Selling time as a share of total, cycle time, ramp time, win rate on stage two and above, admin hours reclaimed per rep per week
CoachingWeekly
At least one live scenario per rep per week, tied to a specific AI-flagged gap
Tool disciplineOngoing
Kill any tool that pushes the count above three AI tools per rep
Definition of doneDay 75
Four weeks of measured before-and-after data
Days 76 to 90: publish the CFO-grade evidence
Signed reportWeek 12
Before-and-after table on the wave-one team, signed by the RevOps lead
ExtrapolationWeek 13
Hours reclaimed multiplied by loaded cost per hour, extrapolated to full team size
Definition of doneDay 90
Wave two approved on evidence rather than politics
What this does not say
Ninety days is a planning horizon, not a promise of return.
- Publisher
- The Revenue AI Report, synthesized plan
- Sample and method
- Built from the Check + Pluris 2026 rollout pattern, Softchoice October 2025, Forrester February 2026, and CI&T June 2026
- Field dates
- Published September 2026
This is an operating plan assembled from published cases, not a tested protocol with a control group.
Also in the record
Figures that sit alongside these charts.
- Reps spent 63% of their time on non-selling work in 2014 and about 60% in 2026 per Salesforce State of Sales. The tool count rose. The tax barely moved.
- Workers lose the equivalent of 51 working days a year to technology friction, up 42% from 2025, per WalkMe's State of Digital Adoption 2026.
- 33% of workers have not used AI at all and 54% bypassed their company's AI tools in the last 30 days. Combined, roughly eight in ten are avoiding or working around it.
- 93% of executives cite change management as the primary AI barrier, per Cornell ILR June 2026. It is also the line item most often cut.
- Gartner expects more than 40% of agentic AI projects to be canceled by the end of 2027, per its April 2026 Hype Cycle.
- CI&T reports 100% team adoption and AI maturity moving from 33 to about 65 out of 100 by embedding AI into existing engineering workflows rather than running a separate program.
- Tim Sanders of G2 at Dreamforce 2026: the majority of agentic outcomes are not driven by frontier capabilities, they are driven by last year's AI.
- Executives at AI companies told the BBC that AI means less work while their own staff described 70 to 90 hour sprint weeks.
The brief
What is going on here, and why it matters.
The charts above are the evidence. This is the read: what the data describes, the mechanism behind it, where the argument could be wrong, and what a revenue team does about it.
What is actually happening
Reps spent 63% of their time on non-selling work in 2014. Salesforce State of Sales puts the 2026 figure at about 60%. Twelve years of tooling moved the number three points. The spend went up, the tool count went up, and the administrative load stayed where it was.
The reason is sequencing. AI was layered on top of the existing process rather than used to remove steps from it. MTLC found 63% of organizations still applying AI to workflows they never rethought. When a capability is added without a matching subtraction, the worker carries both the old task and the new tool, which is what the burnout and bypass numbers on this page are recording.
Why workers are routing around the tools
54% of workers bypassed their company AI tools in the last 30 days and did the work by hand. 33% have not used AI at all. The trust split behind that behavior is wide: 61% of executives trust AI for complex business-critical decisions against 9% of workers, and 88% of executives say employees have adequate tools against 21% of workers.
Forbes named the mechanism that widens the split. Managers are put on the front line to monitor dashboards and push usage, so adoption becomes a performance signal rather than a business practice. Employees respond by using AI to satisfy the metric. The dashboard goes green and nothing downstream moves.
What separates the two rollout patterns
Klarna deployed company-wide, framed the change as cost, and cut headcount from roughly 5,000 to roughly 3,500. Fourteen months later the CEO said the company had gone too far and started rehiring, positioning human support as a premium tier. The failure modes were specific: complex disputes needing judgment, distressed customers needing de-escalation, and multi-step problems falling through the gaps between interactions.
The engineering case ran the opposite sequence. Diagnose the existing tooling and team appetite first, embed engineers rather than schedule training, roll out in three waves over six weeks, and wire adoption into team OKRs so usage was a tracked commitment. The reported result was a 40% lift in PR velocity and 13 contractors offboarded. The technology was not the variable.
Why enablement owns this
Forrester's February 2026 read is that the barrier is readiness rather than functionality, and that enablement teams are historically underresourced while now being asked to manage data hygiene, orchestrate agents, and coordinate content, training, and performance insight across functions.
Braintrust names the fork. AI can score close to every call a rep runs and flag the skipped discovery question or the talk-to-listen spike, but identifying a gap and closing it are two different jobs. Organizations quietly waste the gain when they buy the tool that frees manager time and then fill that time with more reporting instead of more reps in the room with a manager watching.
Where this argument could be wrong
Most of the figures on this page are self-reported and cross-sectional, so none of them establish causation. It is possible that the pilots showing no P&L impact are simply early, and that the 2027 measurements look different once deployments mature.
The counter-case is the consistency. Adoption is high and return is low across four independent publishers using different samples and different definitions, and the worker-side data moves in the same direction as the executive-side data fails to. A measurement error would not usually be that tidy.
What to do with it
The move, by seat.
- CRO
- Refuse a purchase order without a named subtraction. Ask which hour comes off the rep week and who signs the before-and-after.
- Enablement
- Run a one-week activity audit on three to five reps, publish the baseline, and take the top three tasks reps would pay to eliminate into the next vendor conversation.
- RevOps
- Name an operational owner for every agent going into production, accountable when it makes a wrong call at 2am, and hold the count at three AI tools per rep.
- CFO
- Fund change management before the model. Measure hours reclaimed multiplied by loaded cost, not licenses activated or dashboard usage.
Questions this page answers
What the data says, in plain language.
- What does the research show about The Manual Tax?
- Enterprise AI is stalling because leaders bought tools without subtracting work. The receipts on the pilot-to-P&L gap, the executive-worker split, and why enablement becomes the change management owner. Dreamforce 2026 was the biggest production the category has staged. AIforce, Koa, Agentforce, Slackforce, and Claudeforce were on every wall, and Salesforce said 30,000 customers were live on Agentforce. In the hallways, the people carrying the AI mandate for their companies were tired. The sentence that travelled furthest afterwards was the one repeated behind closed doors: we can taste it, but we haven't captured it.
- What does the figure "The talk and the tax, measured in the same year" show?
- Left column is what the market said in 2026. Right column is what the published research recorded in the same twelve months. Source: Compiled by The Revenue AI Report from five published sources. MIT NANDA 2025, Deloitte 2026 Tech Trends, WalkMe State of Digital Adoption 2026, Harvard Business Review 2026, Writer AI Adoption Survey 2026 Fielded Fetched September 2026. Confidence: Medium. Caveat: Five publishers, five different samples. The columns are not two measurements of one population.
- What does the figure "78% have a pilot. 14% have scaled one. 5% can show a P&L line" show?
- Each bar is a separate published measurement of the same journey, not one cohort followed through five stages. Source: Teradata 2026, Writer 2026, MIT NANDA 2025, McKinsey via Softchoice. Four publishers, four independent samples, all fetched September 2026 Confidence: Medium. Caveat: Different samples and different definitions of return. Read the shape, not the arithmetic between bars.
- What does the figure "Executives and workers are describing different companies" show?
- Each row is one statement put to both groups. The distance is the gap in percentage points. Source: WalkMe, State of Digital Adoption 2026, reported by Fortune. Executive and worker samples reported side by side, April 9, 2026 Confidence: Medium. Caveat: Self-reported on both sides. Executives answer about the organization, workers answer about their own day.
- What does the figure "Five in every hundred generative AI pilots produced a measurable P&L line" show?
- Each square is one pilot in a hundred. Filled squares reached a measurable business result. Source: MIT NANDA, State of AI in Business 2025, reported by Fortune. Study of enterprise generative AI pilots, published August 18, 2025 Confidence: Medium. Caveat: Measurable P&L impact is a strict bar. Pilots with unmeasured or indirect value count as failures here.
- What else sits alongside these figures?
- Reps spent 63% of their time on non-selling work in 2014 and about 60% in 2026 per Salesforce State of Sales. The tool count rose. The tax barely moved. Workers lose the equivalent of 51 working days a year to technology friction, up 42% from 2025, per WalkMe's State of Digital Adoption 2026. 33% of workers have not used AI at all and 54% bypassed their company's AI tools in the last 30 days. Combined, roughly eight in ten are avoiding or working around it. 93% of executives cite change management as the primary AI barrier, per Cornell ILR June 2026. It is also the line item most often cut.
- Where does this data come from?
- Every figure is reproduced from a named publisher: Accordion, How conversational CRM reduces sales admin work by 60-80%, Axios, Dreamforce finds itself hosting AI debate, BBC, Tech leaders say AI means less work, their staff say they work up to 90 hours a week, Braintrust Growth, 9 ways AI is actually changing sales enablement in 2026, Check + Pluris, A global wellness brand lifted PR velocity 40% in 6 weeks, CI&T, 100% team adoption and 2x AI maturity for a leading automotive retail group. Sample, field date, and confidence are shown on each chart. Sources marked as vendor research are labelled on the page.
- What could not be confirmed?
- Chicago Booth research cited secondhand claims nearly 30% of employees actively sabotage their employer's AI strategy, rising to 44% among Gen Z. We could not reach the primary study, so it is not charted. The Teradata figures of 78% piloting and 14% scaled are widely quoted in September 2026 coverage. We could not reach a primary Teradata publication with the sample size and field dates, so the bars carry a caveat. Gartner's Agentic AI Hype Cycle prediction that more than 40% of agentic projects will be canceled by end of 2027 sits behind a paywall. It is listed as a takeaway from secondary reporting rather than charted. The per-task hour splits in the Manual Tax ledger are an illustrative model built by this publication. No publisher has released a measured hour-by-hour breakdown of rep admin time at task level.
Cite this page
Permanent URL and suggested citation.
https://www.therevenueaireport.com/research/manual-tax
Kvarfordt, Jonathan. "The Manual Tax." The Revenue AI Report, Research Library. https://www.therevenueaireport.com/research/manual-tax
Figures on this page are reproduced from the publishers listed below. Cite the original publisher for the underlying data, and this page for the compilation and framing.
Sources
Every publisher used on this page.
If a metric, model term, or method on this page is unfamiliar, every one of them is defined in The AI and Revenue Dictionary. Sample size, field date, and confidence tags are explained there too.
Accordion, How conversational CRM reduces sales admin work by 60-80%Vendor research
Consulting analysis, October 2025
https://www.accordion.com/our-insights/knowledge/how-conversational-crm-reduces-sales-admin-work-by-60-80-ai-solutions/Axios, Dreamforce finds itself hosting AI debate
Conference reporting, September 15, 2026
https://www.axios.com/2026/09/15/dreamforce-gathering-ai-slowdownBBC, Tech leaders say AI means less work, their staff say they work up to 90 hours a week
Interview reporting, August 10, 2026
https://www.bbc.com/news/articles/cvgx4yd1gl2oBraintrust Growth, 9 ways AI is actually changing sales enablement in 2026Vendor research
Practitioner analysis, September 4, 2026
https://braintrustgrowth.com/9-ways-ai-is-actually-changing-sales-enablement-in-2026/Check + Pluris, A global wellness brand lifted PR velocity 40% in 6 weeksVendor research
Vendor case study, 2026. Engineering org of 38, six-week engagement
https://checkpluris.com/case-study/a-global-wellness-brand-lifted-pr-velocity-40-in-6-weeksCI&T, 100% team adoption and 2x AI maturity for a leading automotive retail groupVendor research
Vendor case study, June 8, 2026
https://ciandt.com/us/en-us/case-study/100-team-adoption-and-2x-ai-maturity-leading-automotive-retail-groupCornell ILR, Learning and development as a change management lever for AI transformations
Working paper, June 2026
https://www.ilr.cornell.edu/sites/default/files-d8/2026-06/learning-and-development-as-a-change-management-lever-for-ai-transformations.pdfForbes (Kathy Caprino), Why AI adoption is failing inside many companies
Reporting and executive interviews, June 26, 2026
https://www.forbes.com/sites/kathycaprino/2026/06/26/why-ai-adoption-is-failing-inside-many-companies/Forbes, Klarna reverses AI push
Reporting on the CEO's Bloomberg interview, May 18, 2025
https://www.forbes.com/sites/quickerbettertech/2025/05/18/business-tech-news-klarna-reverses-on-ai-says-customers-like-talking-to-people/Forrester, The revenue enablement platform market has hit an inflection point
Analyst blog, February 7, 2026
https://www.forrester.com/blogs/the-revenue-enablement-platform-market-has-hit-an-inflection-point-with-ai-reshaping-everything/Fortune, MIT report: 95% of generative AI pilots at companies are failing
Reporting on MIT NANDA, State of AI in Business 2025, August 18, 2025
https://fortune.com/2025/08/18/mit-report-95-percent-generative-ai-pilots-at-companies-failing-cfo/Fortune, White-collar workers are quietly rebelling against AI
Reporting on WalkMe State of Digital Adoption 2026, April 9, 2026
https://fortune.com/2026/04/09/ai-backlash-quiet-quitting-fobo-obsolete-white-collar-rebellion/Help Net Security, More AI tools, more burnout
Reporting on a Harvard Business Review study of 1,488 US workers, March 9, 2026
https://www.helpnetsecurity.com/2026/03/09/harvard-business-review-ai-workplace-fatigue-report/Inc., Companies may rehire 30% of workers replaced by AI
Reporting on Gartner, September 16, 2026
https://www.inc.com/marcel-schwantes/gartner-companies-rehire-workers-replaced-ai-leadership-lesson/91405844MetaIntro, Bosses pushed workers to use AI and it backfired
Reporting and executive interviews, July 13, 2026
https://www.metaintro.com/blog/bosses-pushed-workers-use-ai-backfiredMomentum.ioVendor research
Vendor product pages and customer statements, September 2026
https://www.momentum.io/MTLC, 2026 AI in revenue enablement report
Industry report, May 29, 2026
https://www.mtlc.co/2026-ai-in-revenue-enablement-report-trends-insights/Softchoice, Why top-down AI mandates fail and what actually worksVendor research
Analysis citing McKinsey, October 29, 2025
https://www.softchoice.com/blogs/application-modernization/why-top-down-ai-mandates-fail-and-what-actually-worksTechCrunch, The first signs of burnout are coming from the people who embrace AI the most
Reporting on the Harvard Business Review study, February 9, 2026
https://techcrunch.com/2026/02/09/the-first-signs-of-burnout-are-coming-from-the-people-who-embrace-ai-the-most/Transformation Playbook, What happened when Klarna replaced 700 customer service agents
Teardown, April 18, 2026
https://transformationplaybook.ai/blog/klarna-ai-customer-serviceWriter, Key findings from our 2026 AI adoption surveyVendor research
Vendor survey, April 14, 2026
https://writer.com/blog/ai-adoption-survey-2026/Yahoo Finance, Dreamforce 2026: business leaders say AI is moving too fast
Conference reporting, September 18, 2026
https://finance.yahoo.com/technology/ai/articles/dreamforce-2026-business-leaders-ai-120114609.html
Could not confirm
What we looked for and did not find.
Claims found during research and not charted
- Chicago Booth research cited secondhand claims nearly 30% of employees actively sabotage their employer's AI strategy, rising to 44% among Gen Z. We could not reach the primary study, so it is not charted.
- The Teradata figures of 78% piloting and 14% scaled are widely quoted in September 2026 coverage. We could not reach a primary Teradata publication with the sample size and field dates, so the bars carry a caveat.
- Gartner's Agentic AI Hype Cycle prediction that more than 40% of agentic projects will be canceled by end of 2027 sits behind a paywall. It is listed as a takeaway from secondary reporting rather than charted.
- The per-task hour splits in the Manual Tax ledger are an illustrative model built by this publication. No publisher has released a measured hour-by-hour breakdown of rep admin time at task level.
How to cite this research
Written by Jonathan Kvarfordt, Founder and Principal Analyst, The Revenue AI Report. Published under CC BY 4.0.
APA
Kvarfordt, J. (2026). The Manual Tax. The Revenue AI Report. Retrieved from https://www.therevenueaireport.com/research/manual-tax
MLA
Kvarfordt, Jonathan. "The Manual Tax." The Revenue AI Report, 31 Aug. 2026, www.therevenueaireport.com/research/manual-tax.
BibTeX
@misc{kvarfordt2026manualtax,
  author = {Kvarfordt, Jonathan},
  title = {The Manual Tax},
  year = {2026},
  publisher = {The Revenue AI Report},
  url = {https://www.therevenueaireport.com/research/manual-tax}
}Next theme
The Task FallacyWhy Anthropic's extreme scenario assumes away the actual job. Eight named reversals, one enterprise return record, and one model with the reinstatement effect turned off.
Subscribe