
The Task Fallacy
Why Anthropic's extreme scenario assumes away the actual job. Eight named reversals, one enterprise return record, and one model with the reinstatement effect turned off.
The short answer
What does the research show about The Task Fallacy?
Evidence
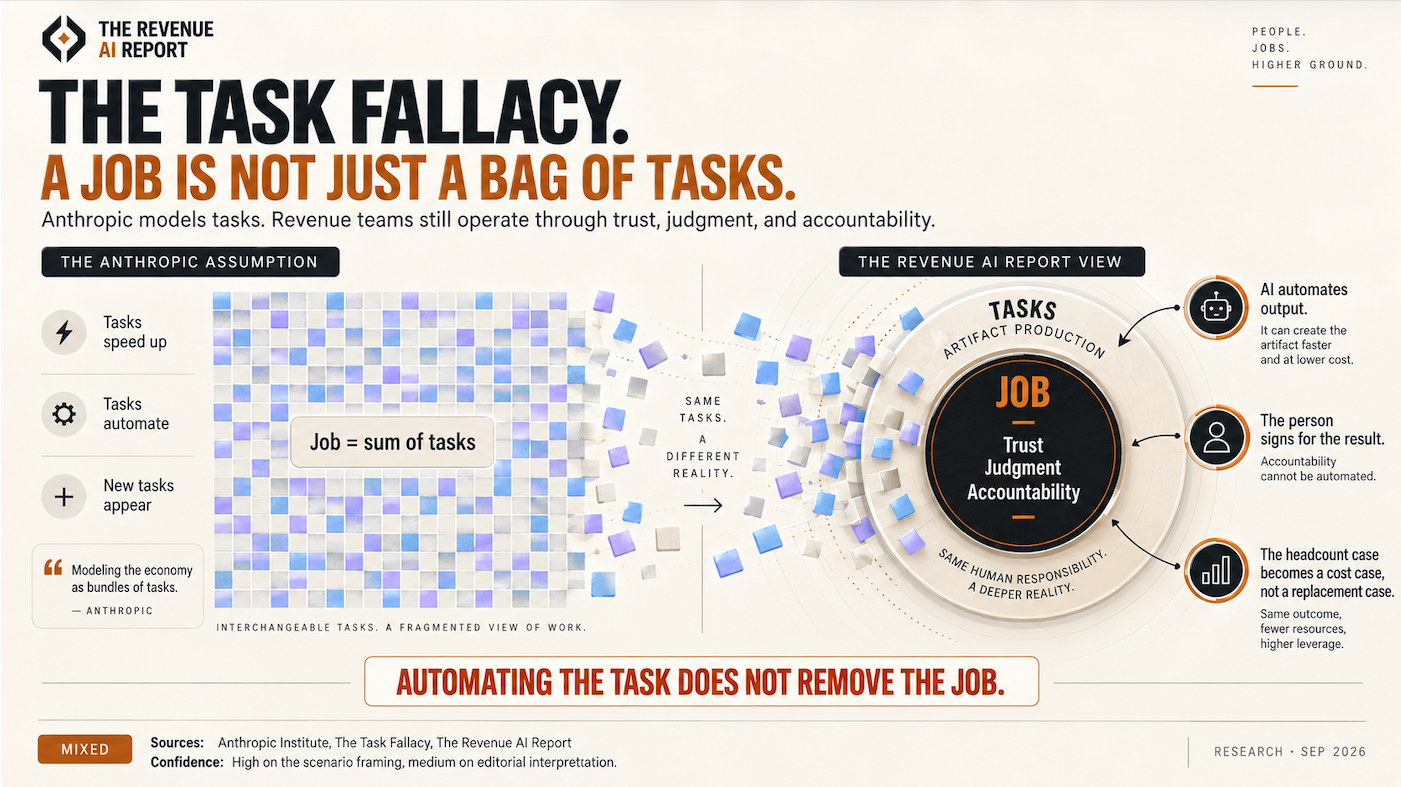
- Buy against a job, not a task. Write the artifact the tool produces, then write who signs for it. If the signer is still a person, the headcount case is a cost case, not a replacement case.
- Price the accountability. Every reversal in the ledger paid twice, once for the automation and once for the human who came back. Put the rehire cost in the business case before the pilot starts.
- Set a kill criterion at purchase. Air Canada, DPD, and Cursor all discovered the criterion after the incident. Name the failure that ends the deployment and the person who calls it.
Supporting pages
- Dictionary plain-language definitions
On 9 September 2026 the Anthropic Institute published Economic Scenarios Working Paper No. 2026-02. The paper runs a model forward to 2030 under three published parameter settings. The extreme setting produced the headline numbers: 17.9% cognitive-worker unemployment, wages 11.5% below the no-AI path, and labor share of income falling from 60% to 45.2%. Those numbers are outputs of a model, not measurements of the economy. The publisher summary explains the three scenarios and states that they are not predictions.
The model reaches those outputs by turning three economic mechanisms to their extremes. The reinstatement ratio is set to 0.00, meaning no new work is created as old tasks disappear. The automation share is set to 0.90, meaning nine in ten AI-performed tasks happen with no human involved. The search discount is set to 0.04, meaning displaced workers barely move between occupations. Every prior wave of automation was absorbed by exactly those three mechanisms, so the extreme scenario is a useful stress test, not a base case.
The gap between a task and a job is what this page tests. A task produces an artifact. A job carries trust, judgment, and accountability for that artifact. The Reversal Ledger shows the same pattern across eight named cases from 2017 to 2025: the artifact was automated, the accountability came back to a person, and the company paid twice.
Enterprise return data matches the ledger, not the extreme scenario. MIT's NANDA initiative found 95% of generative AI pilots delivered zero measurable P&L return. BCG found 74% of companies struggle to scale AI value beyond proof of concept, and only 5% qualify as AI-future built. The charts below explain what the Anthropic model assumes, how real returns look, and which seats are most exposed to the task fallacy.
Eight named reversals. Every one automated what the task frame said was automatable.
Publicly documented reversals of AI task automation, February 2017 to May 2025, in lanes by the kind of event. Klarna is in copper because it is the one case that put humans back at scale.
Shut off or rolled back
IBM Watson at MD AndersonFeb 2017
Oncology advisory project halted after audit, system never used on patients in the pilot scope
DPDJan 2024
Support chatbot swore at a customer and criticised its own employer, AI element disabled
Air CanadaFeb 2024
Tribunal held the airline liable for the chatbot's bereavement-fare answer, the bot came down
McDonald's with IBMJul 2024
Drive-thru voice ordering ended across more than 100 restaurants after order-accuracy failures
CursorApr 2025
Support bot invented a login policy that did not exist, cancellations followed, human review restored
Replaced humans, then rehired
KlarnaMay 2025
CEO said cost had become a too predominant factor, quality fell, human agents brought back
Public walk-back of the message
DuolingoApr 2025
AI-first announcement walked back publicly after user and staff reaction
Program wound down at a loss
Zillow OffersNov 2021
Algorithmic home buying wound down, $421.6M segment loss before tax and roughly a quarter of staff cut
What this does not say
This is a collected set of reported cases, not a sample. It cannot tell you what share of all AI deployments get reversed.
- Publisher
- Bloomberg, Fortune, BBC, Ars Technica, The Register, Forbes, Wired, Restaurant Business, ITV
- Sample and method
- Eight publicly documented cases collected by editorial. Not a probability sample.
- Field dates
- Events dated 19 February 2017 to 9 May 2025
Enterprise AI is not producing the value the extreme scenario requires.
Three surveys, 2024 to 2025, of what corporate AI actually returns.
Share of companies reporting the outcome
- MIT NANDA: generative AI pilots delivering zero measurable P&L return95%
- BCG: companies struggling to scale AI value beyond proof of concept74%
- BCG: companies described as AI-future built5%
What this does not say
A pilot delivering no P&L return is not the same as a failed pilot. Some pilots are learning investments that pay out later.
- Publisher
- MIT NANDA initiative, Boston Consulting Group
- Sample and method
- MIT: 150 leader interviews, 350 employee surveys, analysis of 300 public deployments. BCG figures: global executive surveys.
- Field dates
- MIT published August 2025. BCG scale-value report published October 2024. BCG AI-future built report published 2025. Field windows not fully specified by the publishers.
Three surveys, 2024 to 2025, of what corporate AI actually returns.
| Share of companies reporting the outcome | Value (%) | Note |
|---|---|---|
| MIT NANDA: generative AI pilots delivering zero measurable P&L return | 95 | |
| BCG: companies struggling to scale AI value beyond proof of concept | 74 | |
| BCG: companies described as AI-future built | 5 |
Source: MIT NANDA initiative, Boston Consulting Group. MIT: 150 leader interviews, 350 employee surveys, analysis of 300 public deployments. BCG figures: global executive surveys. Fielded MIT published August 2025. BCG scale-value report published October 2024. BCG AI-future built report published 2025. Field windows not fully specified by the publishers.. Confidence: Medium.
What this does not say: A pilot delivering no P&L return is not the same as a failed pilot. Some pilots are learning investments that pay out later.
The extreme scenario is a dial setting, not a forecast.
Parameter values from Anthropic Working Paper 2026-02, Table 2, evaluated at the start of 2030. The substantial scenario sits between the two columns.
Extreme scenario settings
Reinstatement ratio, new labor tasks created per automated task
0.00
no new work created
Automation share, fraction of AI work done without a human
0.90
nine in ten tasks unsupervised
Search discount, effectiveness of cross-occupation job search
0.04
workers barely move
Posting speed, monthly absorption by other occupations
0.50
Affected task mass, share of all tasks AI can reach by 2030
0.50
Modest scenario settings
Reinstatement ratio
0.50
new work created
Automation share
0.50
half the tasks keep a human
Search discount
0.17
workers move between occupations
Posting speed
0.10
Affected task mass
not published for this scenario
Extreme is the setting where the reinstatement effect is turned off and 90% of AI-performed work happens with no human. Those are choices, not forecasts.
What this does not say
The paper does not attach probabilities to these scenarios and explicitly states they are not predictions.
- Publisher
- The Anthropic Institute
- Sample and method
- Working Paper No. 2026-02, Table 2, parameter values for the published scenarios.
- Field dates
- Paper published 9 September 2026. Base period 2024, anchor mid-2026, evaluation start of 2030.
Three scenarios. One shifted assumption at a time.
Same Anthropic model, three published parameter sets, five outputs at 2030. Read each panel left to right across the scenarios.
2030 GDP versus the no-AI path · percent
Economy-wide unemployment · percent
Cognitive-worker unemployment · percent, modest not published
Cognitive-worker wages versus no-AI · percent, zero line is the no-AI path
Labor share of income · percent, no-AI baseline 60
The extreme scenario produces its results only when the reinstatement ratio is 0.00, the automation share is 0.90, and the search discount is 0.04. Real-economy evidence for those settings is absent.
What this does not say
These are outputs of the Anthropic model at the parameter values the authors chose for each scenario. They are not empirical measurements of 2030.
- Publisher
- The Anthropic Institute
- Sample and method
- Working Paper No. 2026-02, published scenario outputs for 2030.
- Field dates
- Paper published 9 September 2026, scenario values evaluated at the start of 2030
Also in the record
Figures that sit alongside these charts.
- Buy against a job, not a task. Write the artifact the tool produces, then write who signs for it. If the signer is still a person, the headcount case is a cost case, not a replacement case.
- Price the accountability. Every reversal in the ledger paid twice, once for the automation and once for the human who came back. Put the rehire cost in the business case before the pilot starts.
- Set a kill criterion at purchase. Air Canada, DPD, and Cursor all discovered the criterion after the incident. Name the failure that ends the deployment and the person who calls it.
- Treat the extreme scenario as a stress test. Ask what your plan looks like at a reinstatement ratio of zero, then ask what evidence you have that your own function is anywhere near that setting.
- Measure the trust share of each seat before you automate it. The higher that share, the smaller the headcount effect of automating the artifact, and the more the tool has to justify itself on cycle time rather than on people.
Questions this page answers
What the data says, in plain language.
- What does the research show about The Task Fallacy?
- Why Anthropic's extreme scenario assumes away the actual job. Eight named reversals, one enterprise return record, and one model with the reinstatement effect turned off. On 9 September 2026 the Anthropic Institute published Economic Scenarios Working Paper No. 2026-02. The paper runs a model forward to 2030 under three published parameter settings. The extreme setting produced the headline numbers: 17.9% cognitive-worker unemployment, wages 11.5% below the no-AI path, and labor share of income falling from 60% to 45.2%. Those numbers are outputs of a model, not measurements of the economy. The publisher summary explains the three scenarios and states that they are not predictions.
- What does the figure "Eight named reversals. Every one automated what the task frame said was automatable" show?
- Publicly documented reversals of AI task automation, February 2017 to May 2025, in lanes by the kind of event. Klarna is in copper because it is the one case that put humans back at scale. Source: Bloomberg, Fortune, BBC, Ars Technica, The Register, Forbes, Wired, Restaurant Business, ITV. Eight publicly documented cases collected by editorial. Not a probability sample. Fielded Events dated 19 February 2017 to 9 May 2025. Confidence: Medium.
- What does the figure "Enterprise AI is not producing the value the extreme scenario requires" show?
- Three surveys, 2024 to 2025, of what corporate AI actually returns. Source: MIT NANDA initiative, Boston Consulting Group. MIT: 150 leader interviews, 350 employee surveys, analysis of 300 public deployments. BCG figures: global executive surveys. Fielded MIT published August 2025. BCG scale-value report published October 2024. BCG AI-future built report published 2025. Field windows not fully specified by the publishers.. Confidence: Medium.
- What does the figure "The extreme scenario is a dial setting, not a forecast" show?
- Parameter values from Anthropic Working Paper 2026-02, Table 2, evaluated at the start of 2030. The substantial scenario sits between the two columns. Source: The Anthropic Institute. Working Paper No. 2026-02, Table 2, parameter values for the published scenarios. Fielded Paper published 9 September 2026. Base period 2024, anchor mid-2026, evaluation start of 2030.. Confidence: High.
- What does the figure "The more the job runs on trust, the wider the gap between task automation and job replacement" show?
- Editorial estimates by role of the share of the wage that pays for trust, judgment, and accountability rather than artifact production. Source: The Revenue AI Report. Editorial estimate based on the reversal ledger and the role composition of enterprise revenue teams. Fielded Compiled September 2026. Confidence: Low.
- What else sits alongside these figures?
- Buy against a job, not a task. Write the artifact the tool produces, then write who signs for it. If the signer is still a person, the headcount case is a cost case, not a replacement case. Price the accountability. Every reversal in the ledger paid twice, once for the automation and once for the human who came back. Put the rehire cost in the business case before the pilot starts. Set a kill criterion at purchase. Air Canada, DPD, and Cursor all discovered the criterion after the incident. Name the failure that ends the deployment and the person who calls it. Treat the extreme scenario as a stress test. Ask what your plan looks like at a reinstatement ratio of zero, then ask what evidence you have that your own function is anywhere near that setting.
- Where does this data come from?
- Every figure is reproduced from a named publisher: Anthropic Institute, Economic Scenarios Working Paper No. 2026-02, Anthropic Institute, economic scenarios overview, MIT NANDA initiative, coverage by Fortune, Boston Consulting Group, AI adoption in 2024, Boston Consulting Group, are you generating value from AI, The Revenue AI Report, Reversal Ledger. Sample, field date, and confidence are shown on each chart. Sources marked as vendor research are labelled on the page.
- What could not be confirmed?
- A published probability for any of the three Anthropic scenarios. The paper states the scenarios are not predictions and attaches no likelihoods. A measured reinstatement ratio for enterprise revenue functions. No publisher has produced one, so the trust-share chart on this page is an editorial estimate and is labeled as such.
Cite this page
Permanent URL and suggested citation.
https://www.therevenueaireport.com/research/task-fallacy
Kvarfordt, Jonathan. "The Task Fallacy." The Revenue AI Report, Research Library. https://www.therevenueaireport.com/research/task-fallacy
Figures on this page are reproduced from the publishers listed below. Cite the original publisher for the underlying data, and this page for the compilation and framing.
Sources
Every publisher used on this page.
If a metric, model term, or method on this page is unfamiliar, every one of them is defined in The AI and Revenue Dictionary. Sample size, field date, and confidence tags are explained there too.
Anthropic Institute, Economic Scenarios Working Paper No. 2026-02
Table 2 parameter values and 2030 scenario outputs, published 9 September 2026
https://www-cdn.anthropic.com/files/4zrzovbb/website/cf58f84d46a4a76bf5a5b039ac695fba6b80041c.pdfAnthropic Institute, economic scenarios overview
Publisher summary of the three published scenarios
https://www.anthropic.com/institute/econ-scenariosMIT NANDA initiative, coverage by Fortune
150 leader interviews, 350 employee surveys, 300 public deployments. 95% of generative AI pilots delivering zero measurable P&L return, published August 2025
https://fortune.com/2025/08/18/mit-report-95-percent-generative-ai-pilots-at-companies-failing-cfo/Boston Consulting Group, AI adoption in 2024
74% of companies struggle to achieve and scale value, published 24 October 2024
https://www.bcg.com/press/24october2024-ai-adoption-in-2024-74-of-companies-struggle-to-achieve-and-scale-valueBoston Consulting Group, are you generating value from AI
5% of companies described as AI-future built, published 2025
https://www.bcg.com/publications/2025/are-you-generating-value-from-ai-the-widening-gapThe Revenue AI Report, Reversal Ledger
Maintained record of named AI reversals with dates and sources
https://www.therevenueaireport.com/reversal-ledger
Could not confirm
What we looked for and did not find.
Claims found during research and not charted
- A published probability for any of the three Anthropic scenarios. The paper states the scenarios are not predictions and attaches no likelihoods.
- A measured reinstatement ratio for enterprise revenue functions. No publisher has produced one, so the trust-share chart on this page is an editorial estimate and is labeled as such.
How to cite this research
Written by Jonathan Kvarfordt, Founder and Principal Analyst, The Revenue AI Report. Published under CC BY 4.0.
APA
Kvarfordt, J. (2026). The Task Fallacy. The Revenue AI Report. Retrieved from https://www.therevenueaireport.com/research/task-fallacy
MLA
Kvarfordt, Jonathan. "The Task Fallacy." The Revenue AI Report, 31 Aug. 2026, www.therevenueaireport.com/research/task-fallacy.
BibTeX
@misc{kvarfordt2026taskfallacy,
  author = {Kvarfordt, Jonathan},
  title = {The Task Fallacy},
  year = {2026},
  publisher = {The Revenue AI Report},
  url = {https://www.therevenueaireport.com/research/task-fallacy}
}Next theme
The Proof Gap has a measured sizeEvery GTM function adopted AI faster than it produced revenue. One dataset measures both sides in the same sample.
Subscribe