
The Revenue AI Report · Research report
Revenue Pain Index 2026: Year in Trends
What 2026’s revenue-team pressures mean for the next budget: higher expectations, usage-based AI bills, customer data and proof of results.
By Jonathan Kvarfordt · · January 1 to November 13, 2026
Key takeaways
- AI spending belongs in the revenue plan, not beside it as a separate experiment.
- Usage-based pricing makes cost controls and accepted outcomes more important than seat counts.
- Customer data and a named owner come before expanding automation.
- Less category attention is not proof of failure. Test the workflow, not the hype.
AI added a second job. It did not replace the revenue target.
Revenue leaders entered 2026 with a familiar obligation: deliver the number. AI added another obligation: explain what the technology would cost, who would build and maintain it, and whether it would produce revenue rather than more activity. The Revenue Pain Index suggests that these obligations converged as the year progressed.
The practical reading is not that every company experienced the same problems. It is that quota pressure, usage-based tool bills, unreliable customer data and demands for AI proof increasingly belong in the same planning conversation. Buying another tool does not resolve those dependencies.
What the index can tell you
The Revenue Pain Index is an editorial assessment of recurring problems in public revenue-team discussion and cited research, covering January 1 to November 13, 2026. Its 0 to 100 scores describe how prominent and economically consequential a problem appears in the evidence. A score of 85 does not mean 85% of leaders have that problem, nor does a rising score measure an increase in company costs.
In the report’s reading guide, 80 or more means dominant, 60 to 79 broad and steady, 40 to 59 narrow, and below 40 fringe or fading. Scores are analyst judgments, not automated counts. The formula and weights are not published. Use the index to prioritize questions, not to calculate a return on investment or forecast revenue.
A pattern is supported across at least three source types, multiple authors and multiple months. A signal has thinner evidence but a dated basis for attention. Not enough data means the report cannot support a score. It is never treated as zero. Research and AI terms, explained.
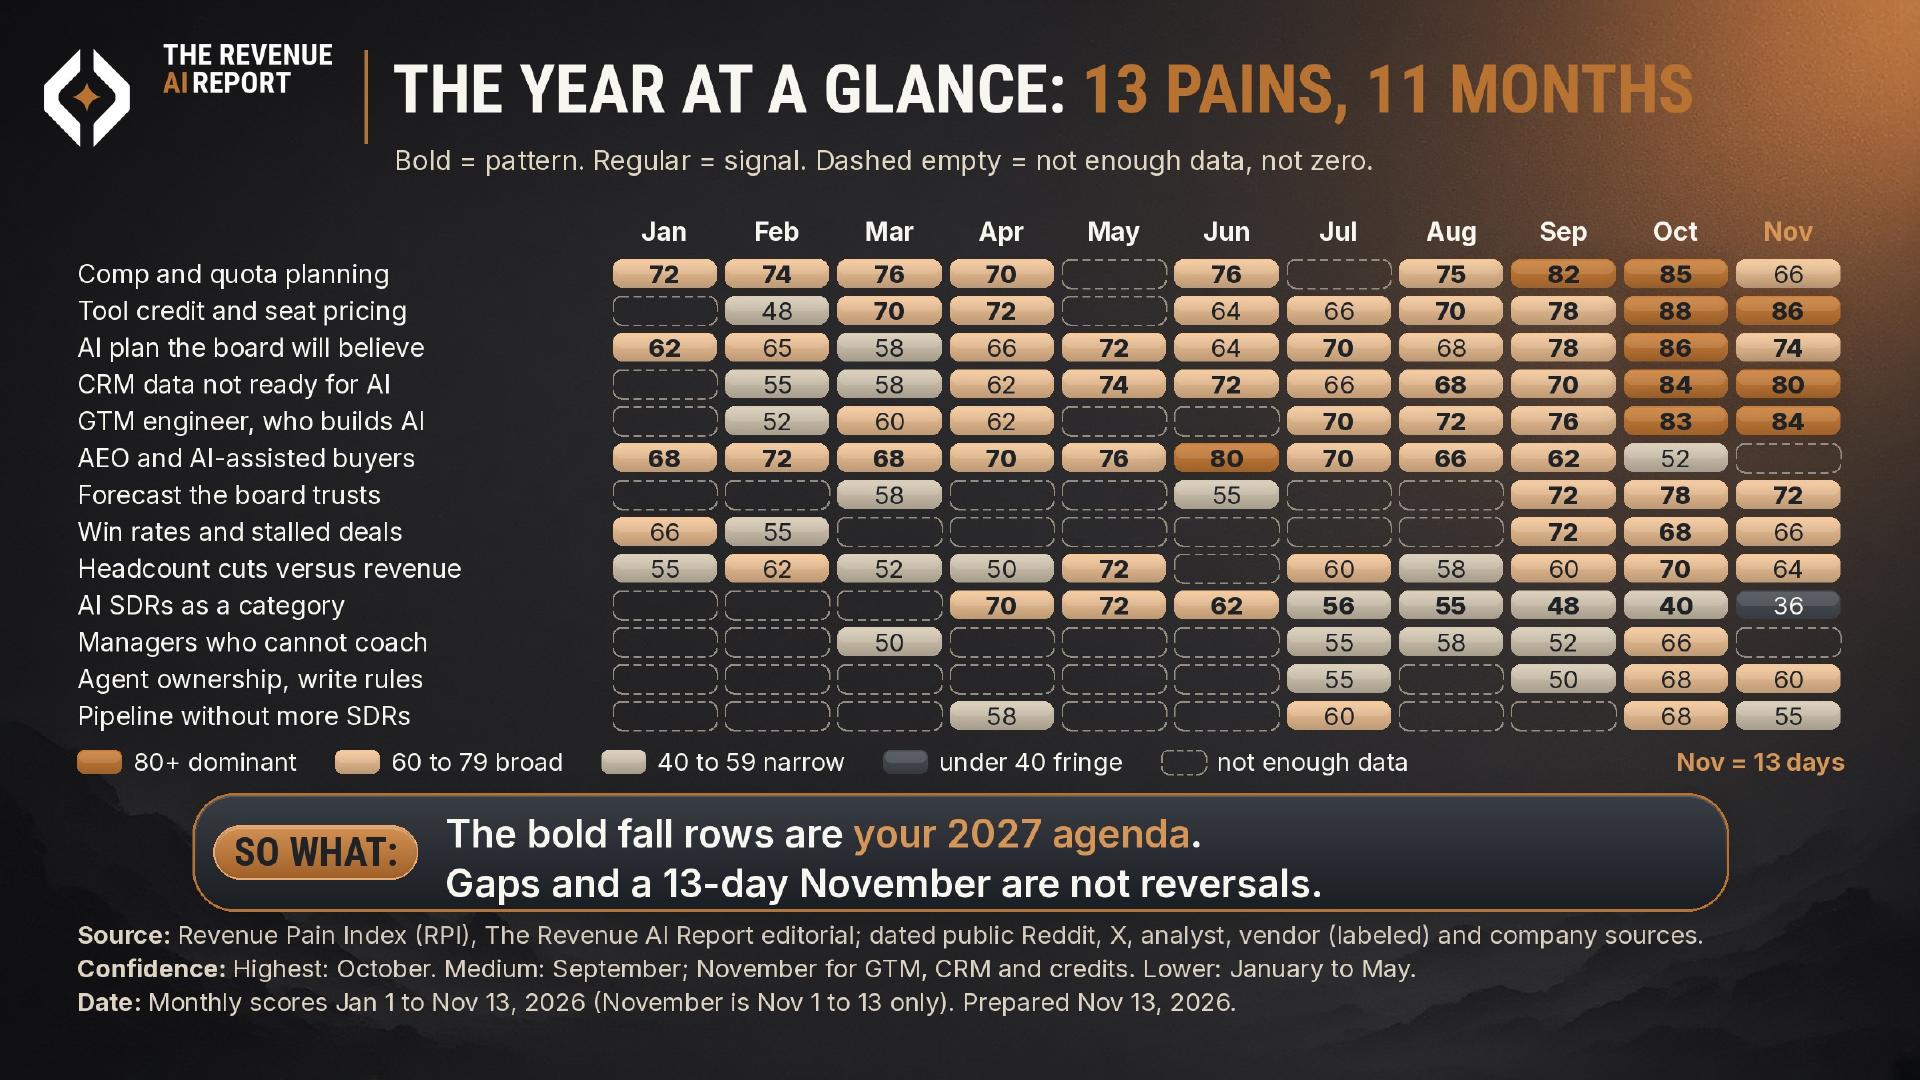
The year at a glance
The matrix shows why the late-year agenda matters: quota and compensation remained persistent concerns while tool pricing, customer data and responsibility for building AI became more prominent. The report gives October the highest confidence because it combines a dedicated study with the fall survey wave. Earlier months carry less weight, so small score differences should not drive budget decisions.
Quota pressure makes AI proof a revenue question
Quota and compensation were not a passing AI trend. They remained an underlying operating problem throughout the scored months. That matters because an AI initiative must fit the existing revenue commitment, not sit beside it as a separate technology experiment.
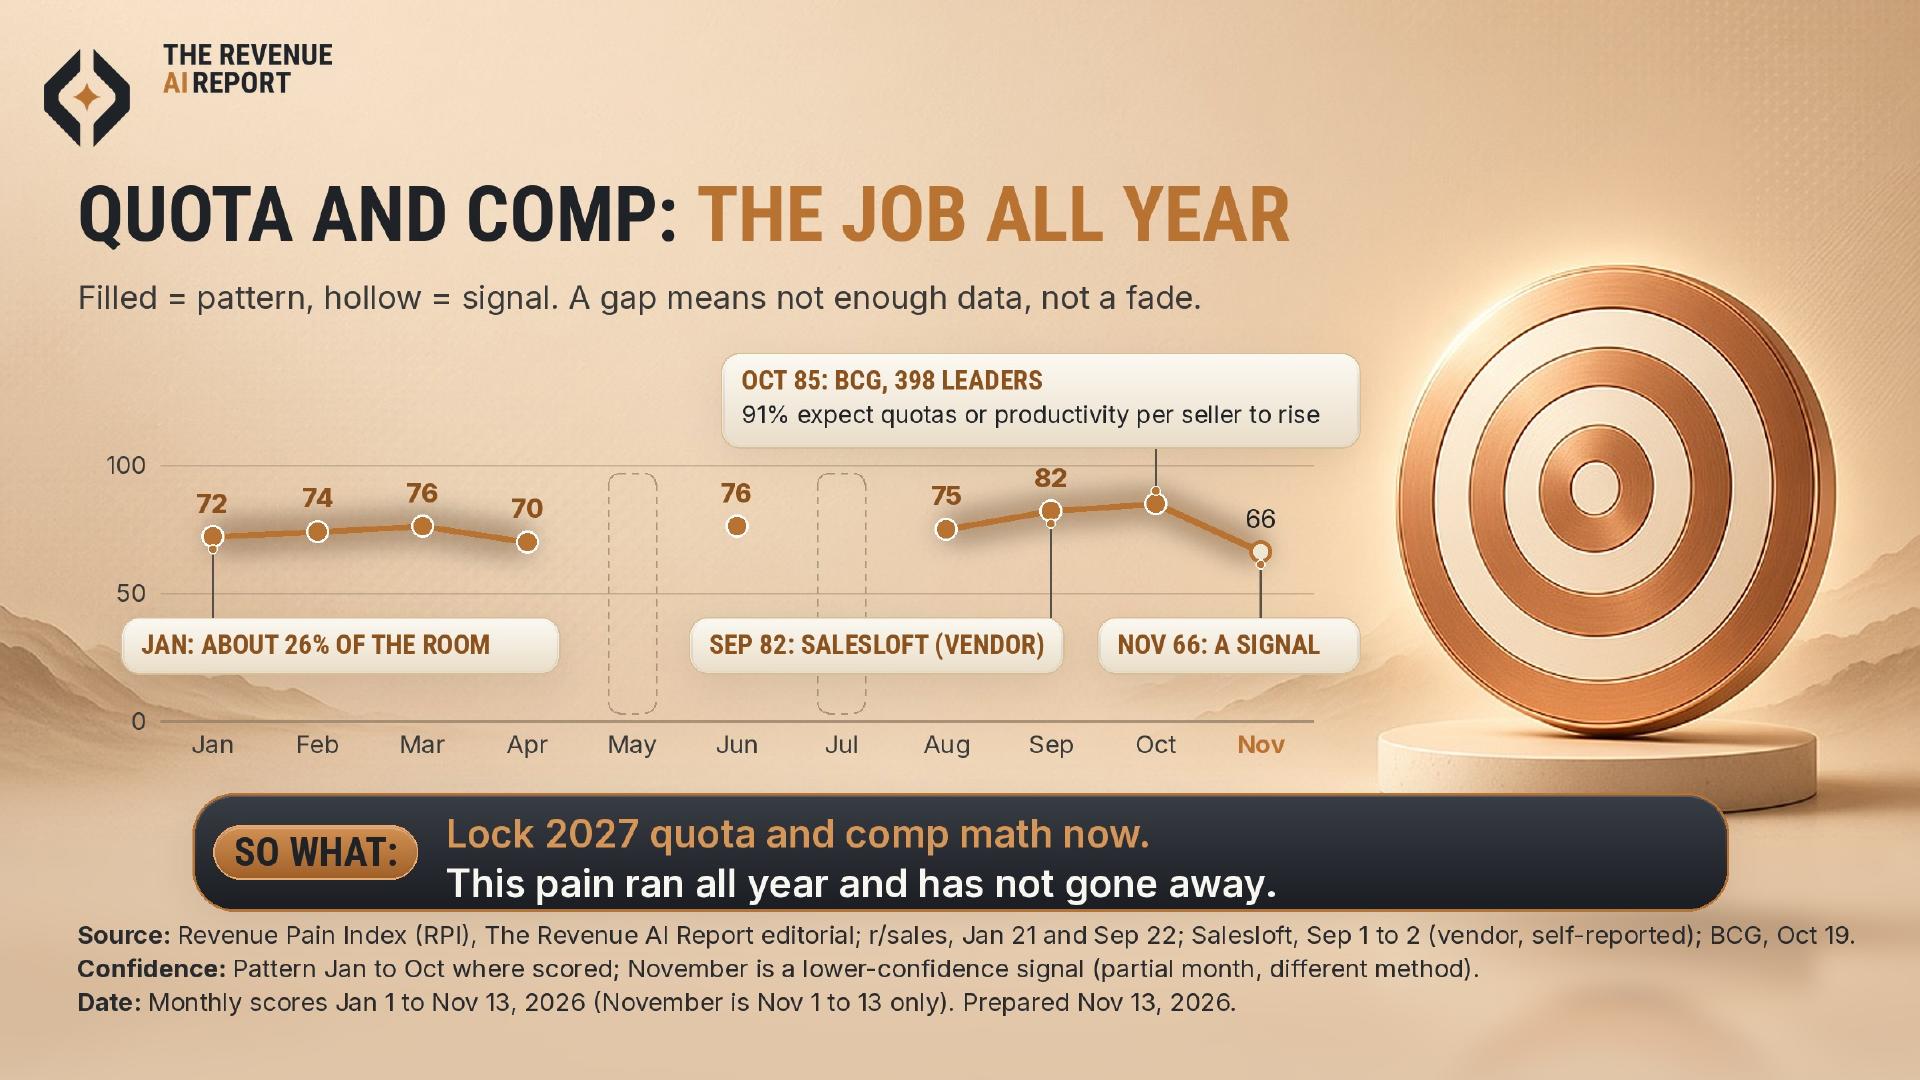
The report cites BCG’s October 19 survey of 398 leaders: 91% expected quotas or productivity per seller to rise. This is a survey expectation, not the index score and not proof that targets were achieved. It helps explain why time-saving claims alone may be insufficient: leaders still need a credible account of how the team will deliver more.
For 2027 planning, connect the quota and compensation assumptions to the AI proposal. Specify the accepted revenue outcome and how it will be measured. The provisional November reading is not a reason to relax the target: it covers only part of the month and carries lower confidence.
Credits make the tool bill an operating decision
The pricing story shifted from counting licensed users to understanding consumption. With credits and usage-based charges, a purchase price alone cannot tell a revenue leader what a workflow will cost to run. More activity can mean a larger bill without a better business result.
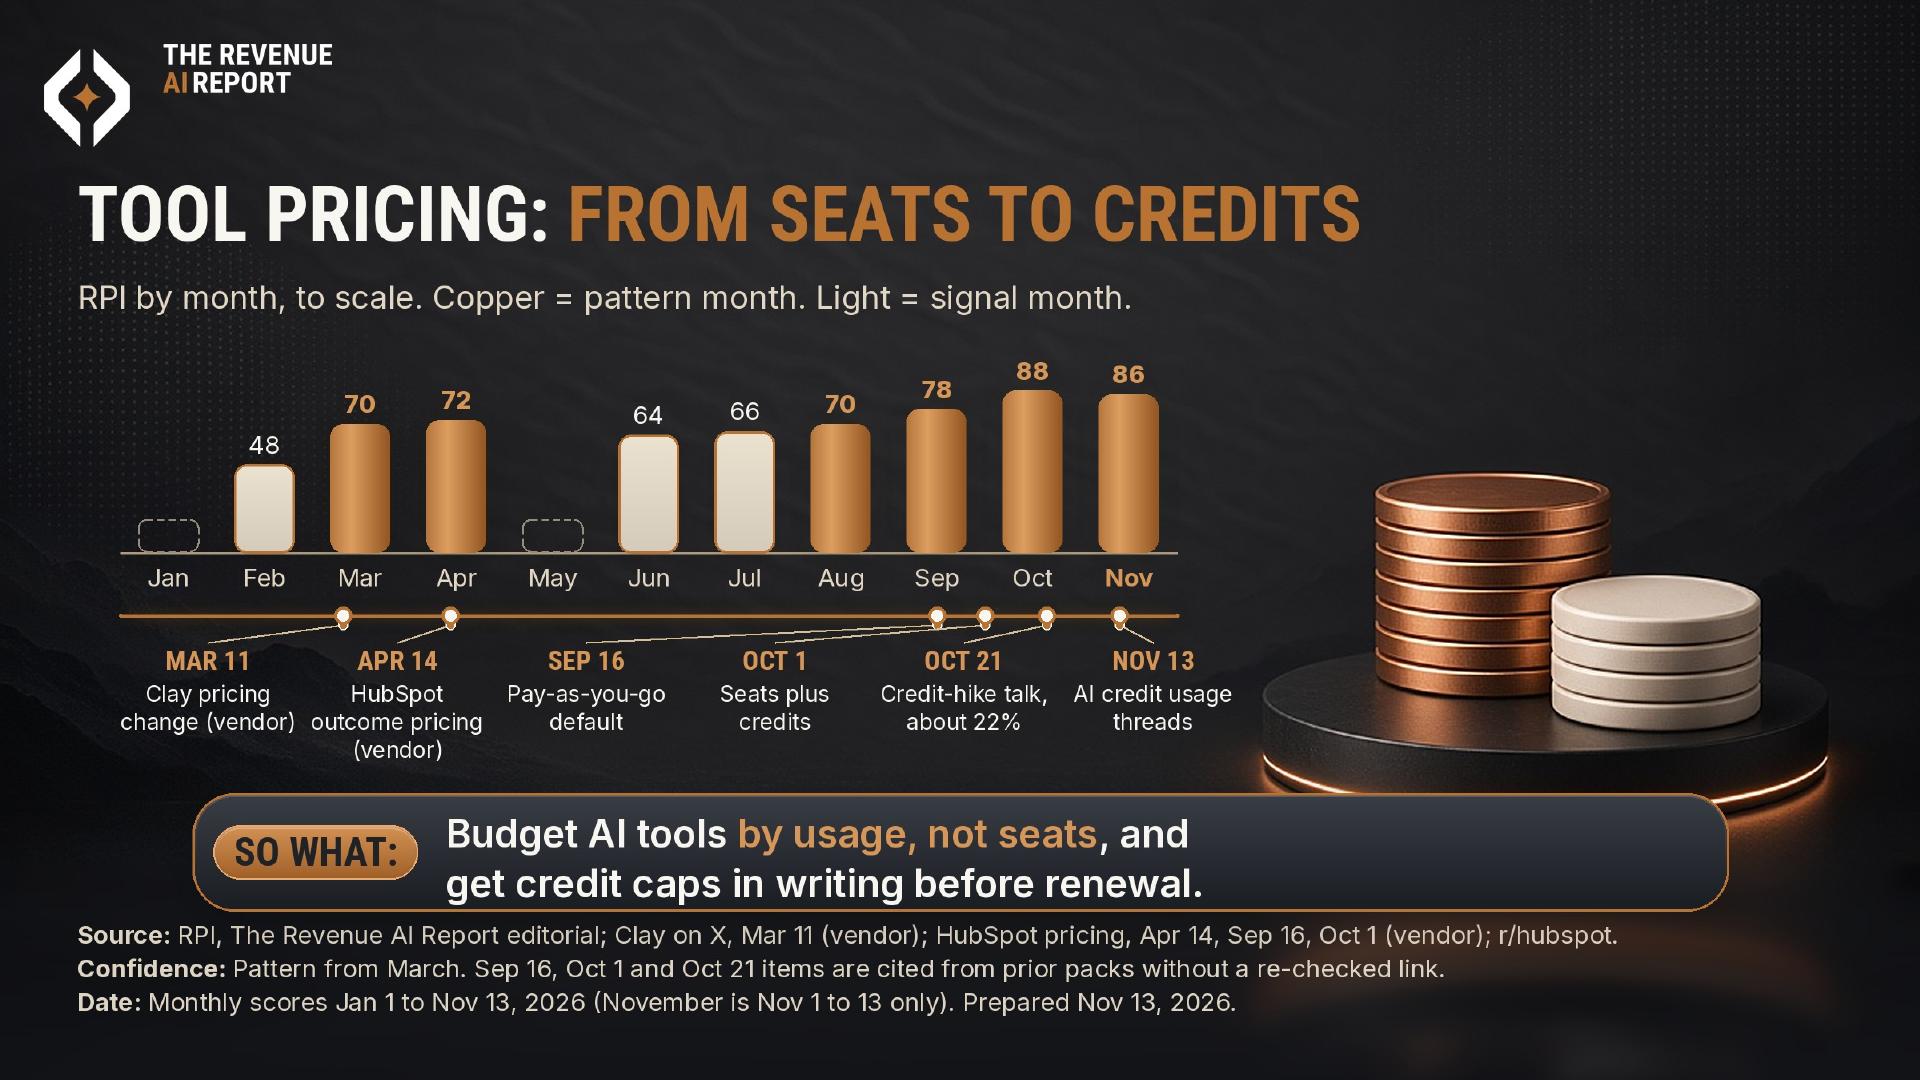
The report traces this concern through Clay and HubSpot pricing material and customer discussion. Vendor pricing announcements explain packaging; community posts describe experiences. Neither establishes a representative average cost across companies. Some later HubSpot packaging references were not re-checked, so the precise chronology should not be treated as a verified buying guide.
The decision is therefore about cost control, not simply seat reduction. Before renewal, ask what consumes credits, what happens when allowances run out, and whether a usage cap can be written into the agreement. Compare the bill with accepted outcomes, not with the volume of AI actions.
Independent receipts, benchmarks and post-mortems. One email a week.
The board needs an outcome, not a feature tour
The report reads the board’s AI question as a shift from how to begin toward how to prove a result. Its evidence combines analyst research and labeled vendor surveys. Those sources ask different questions, so they should not be stitched together as a single adoption rate or a measured before-and-after change.
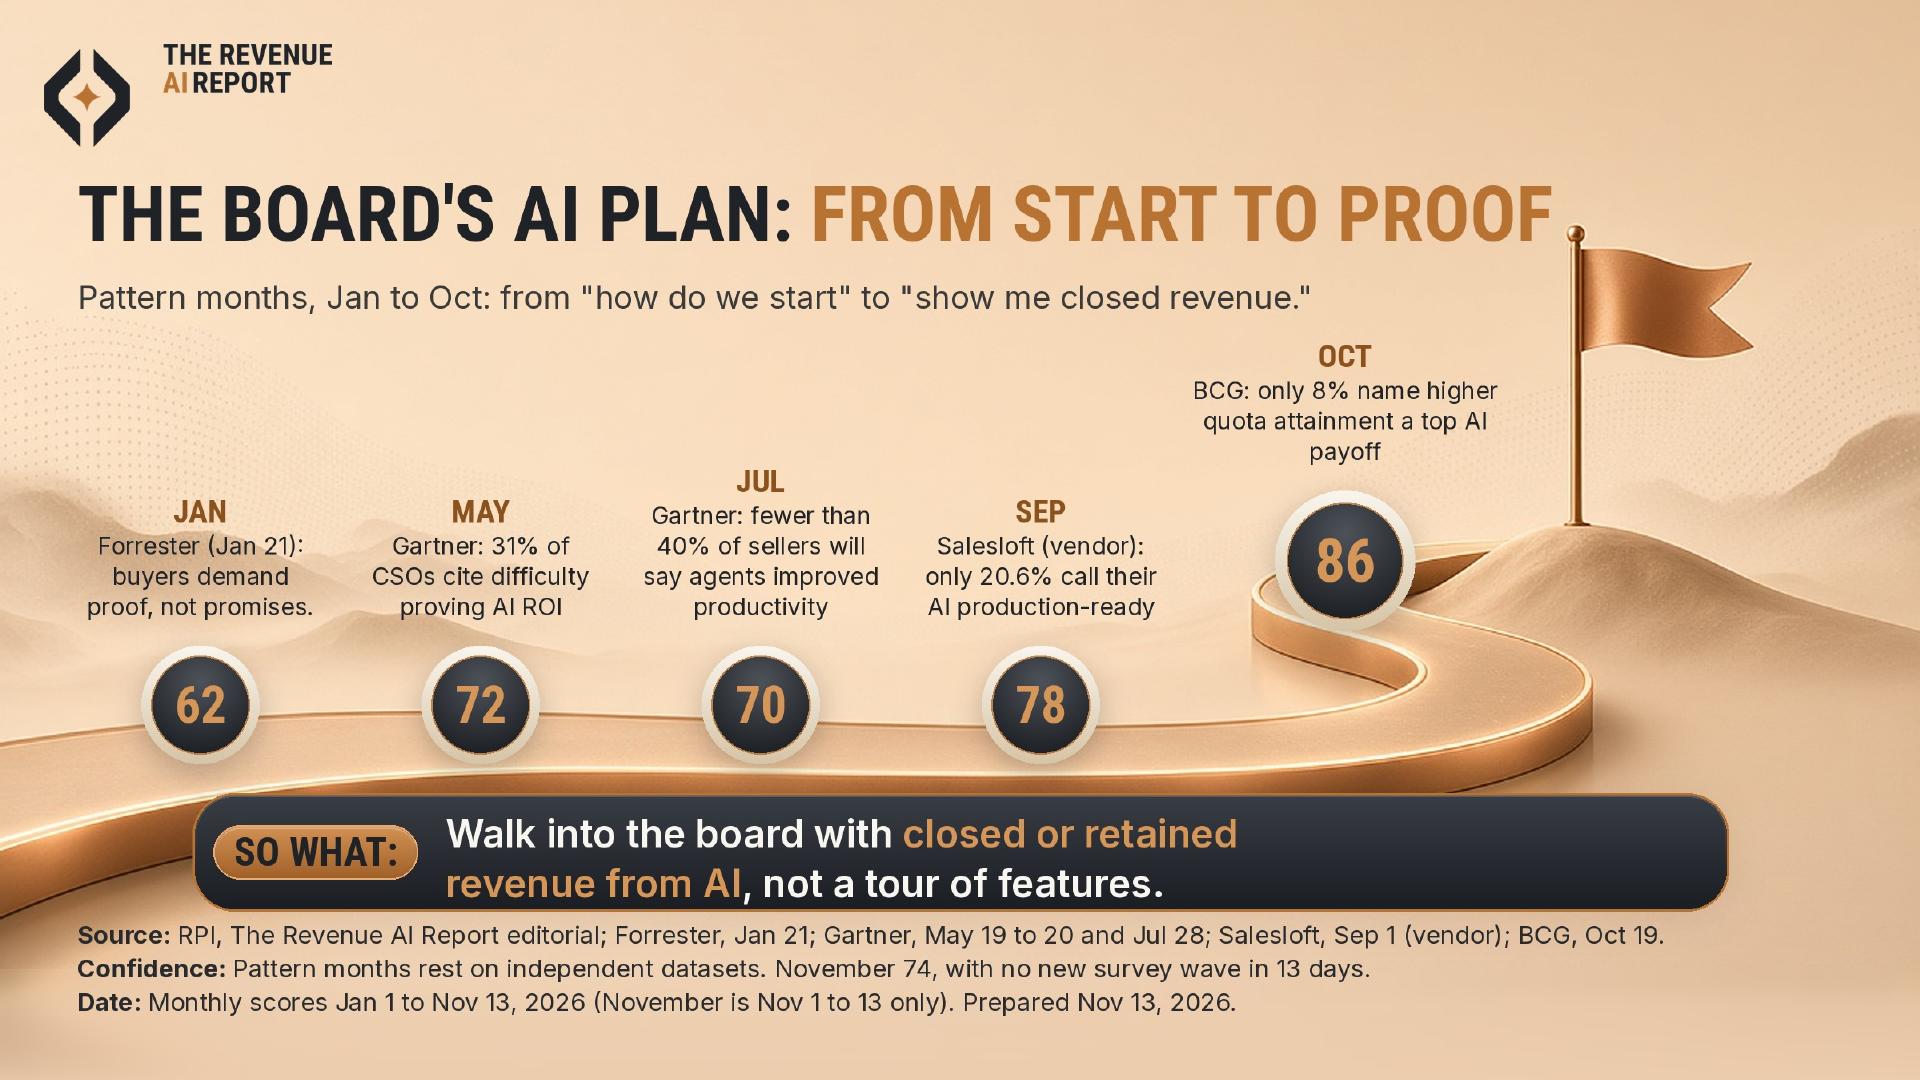
The distinction is practical. A system can be in production, generate useful work and still have no demonstrated effect on closed or retained revenue. Those are separate claims. A board update should say which has been established and which is still an assumption.
Present the business outcome, the evidence supporting it and the remaining limits. Where only time saved has been measured, report time saved. Do not turn it into a revenue claim without a supported connection.
Customer data and ownership are prerequisites
Two problems became more prominent together: customer relationship management (CRM) data that was not ready for AI, and uncertainty about who would build the revenue system. The report treats their late-year evidence as stronger than their early signals. That does not prove one caused the other, but it points to a shared implementation problem.
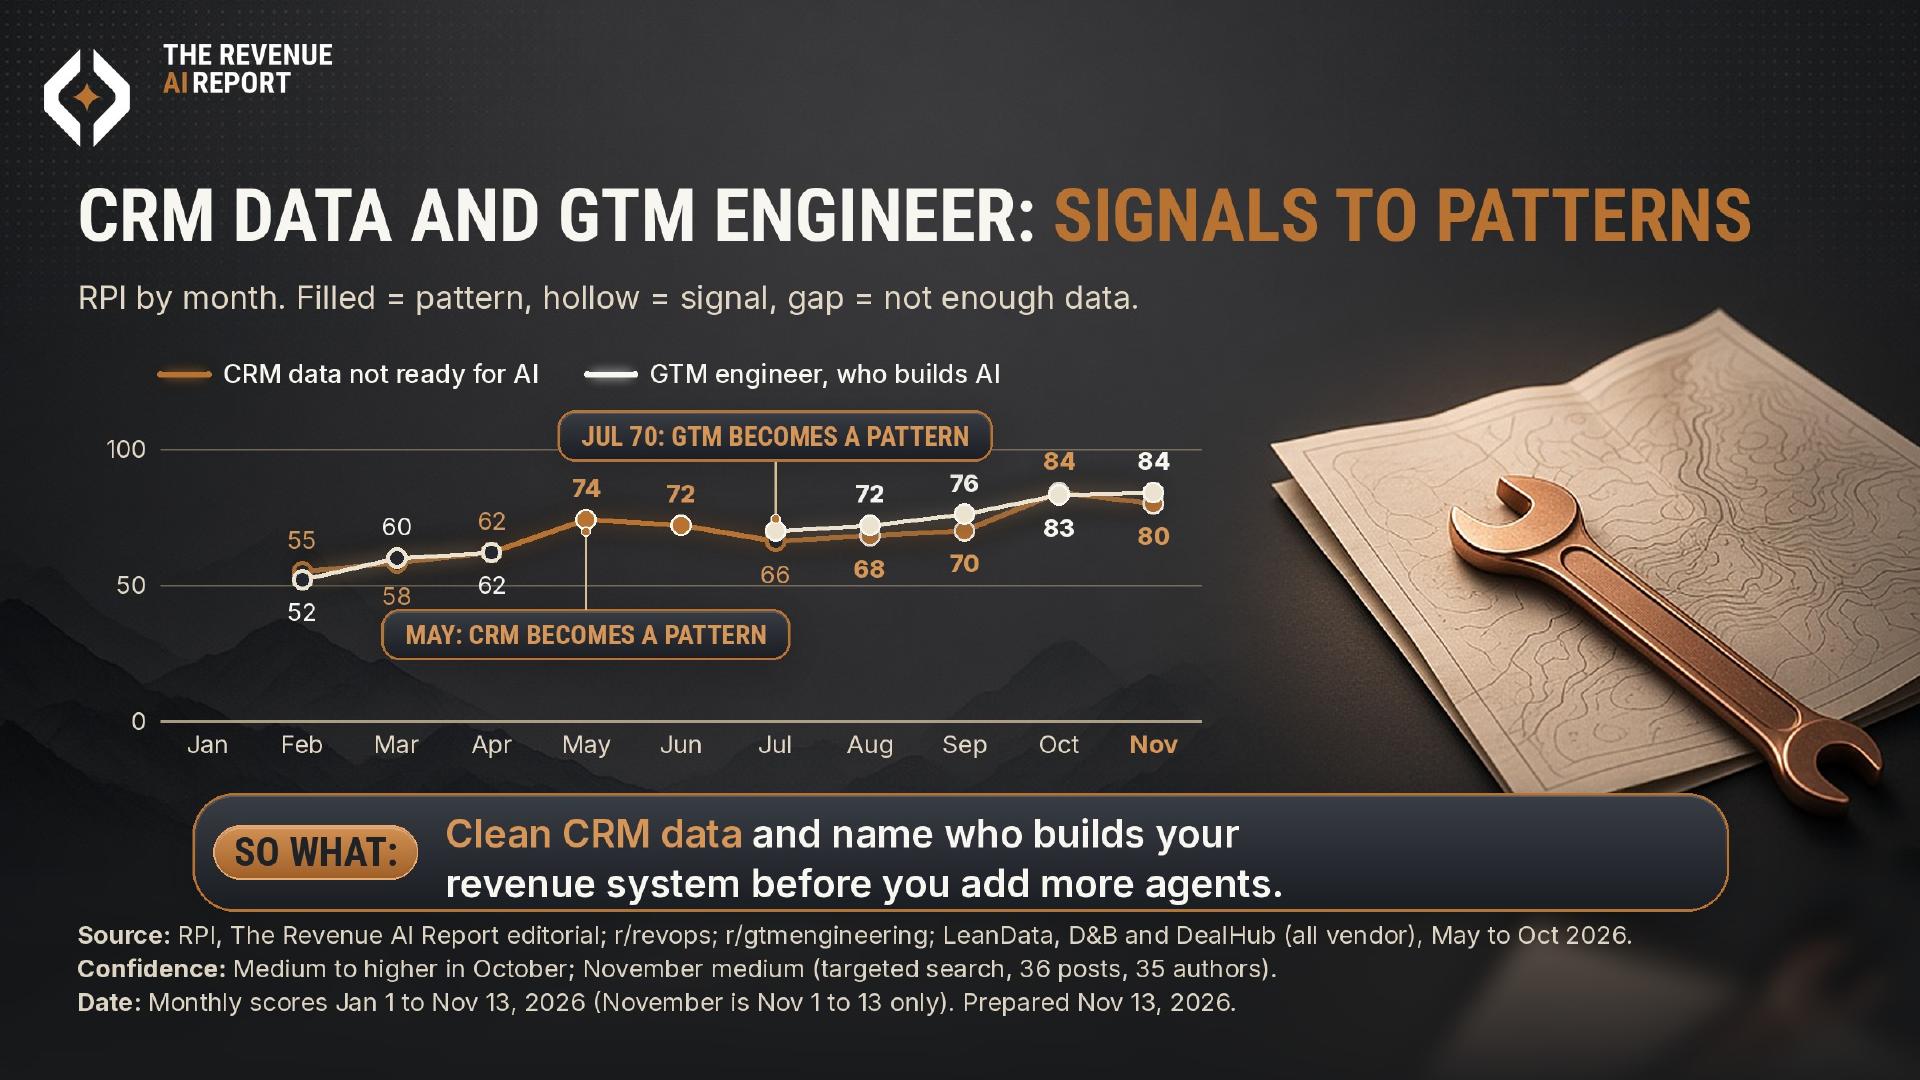
An agent that acts on incomplete customer records still needs someone responsible for the result. A tool purchase does not assign that responsibility or repair the records. In the report, “GTM engineer” refers to the person building and maintaining the go-to-market workflows, not evidence that every company needs a new job title.
For a company with a real revenue team and a CRM, start with the workflow: which records it relies on, what it is allowed to change and who accepts the output. Clean the relevant data and name the owner before adding more agents. This is an operating recommendation, not a measured company-size ranking.
Fading attention is not proof that a category failed
Discussion of AI sales development representatives (AI SDRs) and answer engine optimization (AEO), or visibility in AI-generated answers, peaked mid-year and became less prominent in the report’s evidence. The charts describe the strength of that evidence, not vendor revenue, customer adoption or a universal verdict on either category.
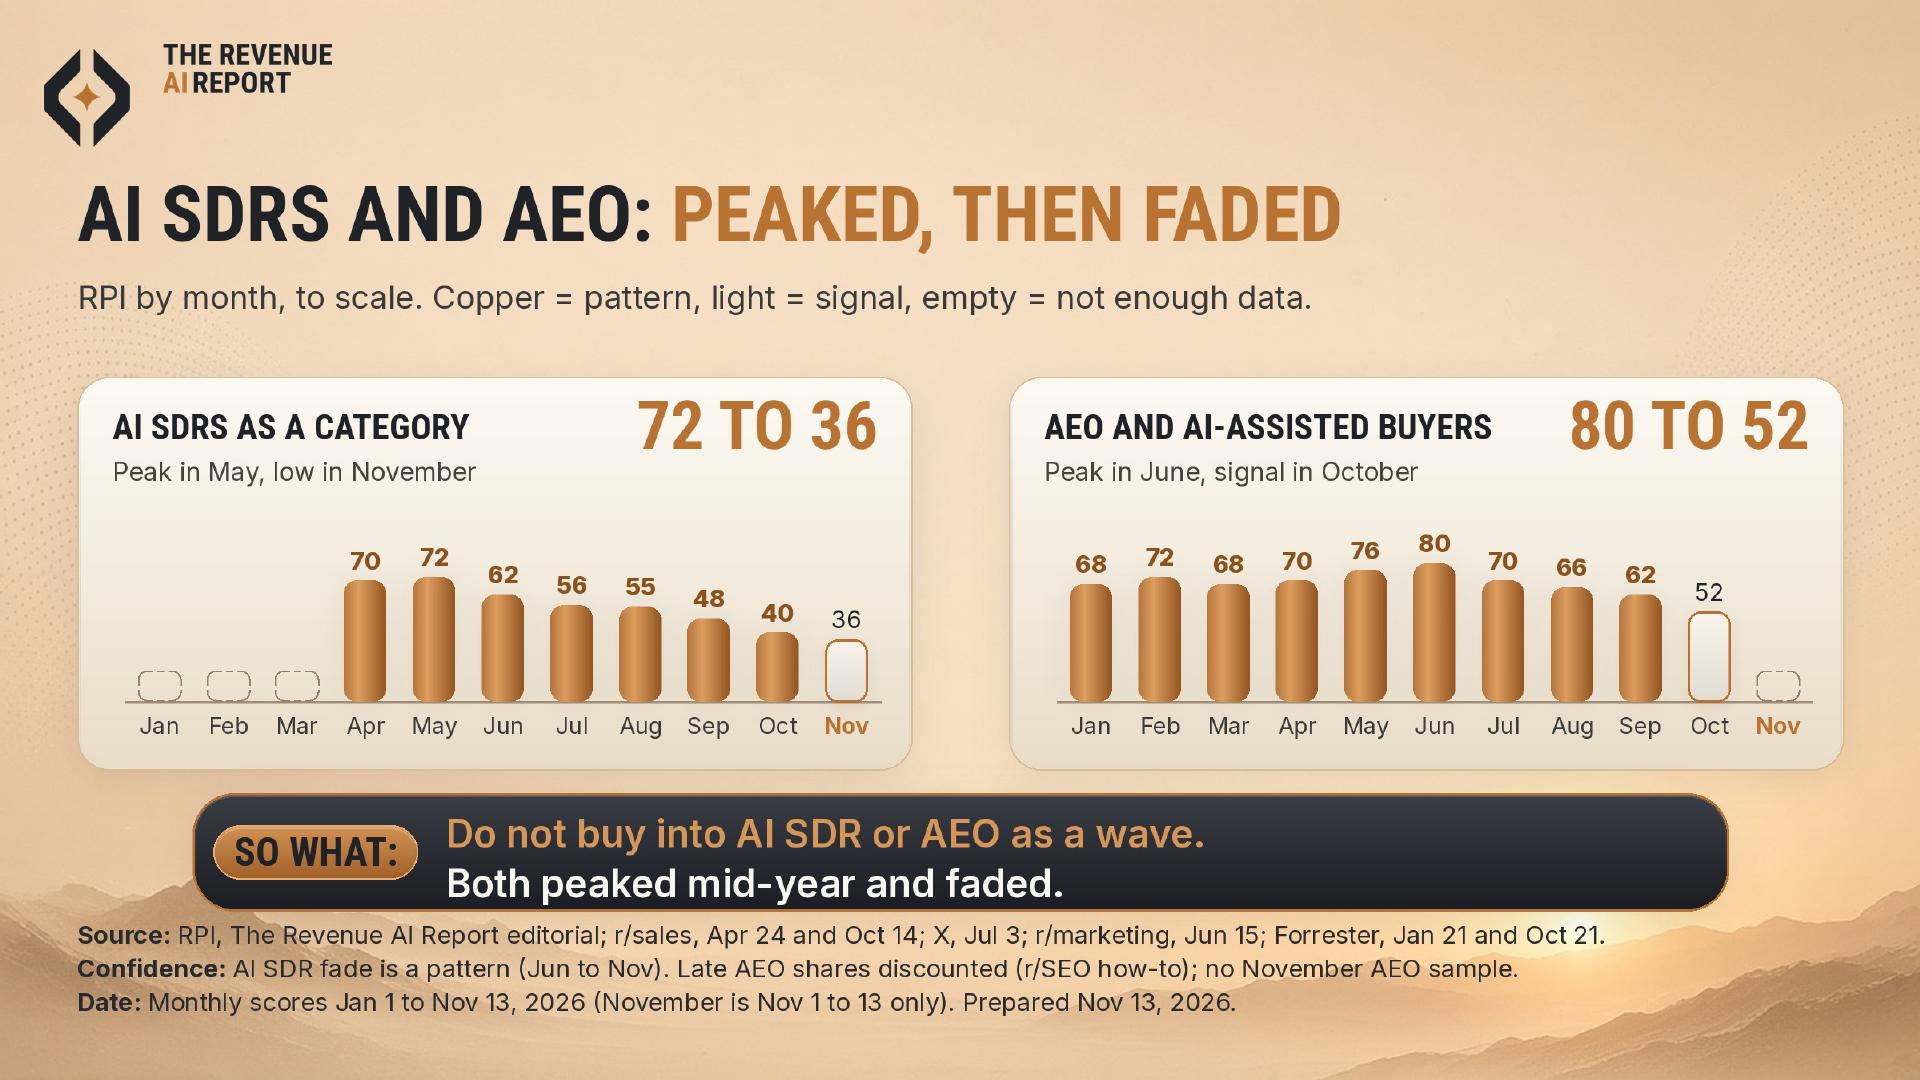
The AI SDR decline spans several months. AEO has no November score because the report lacks a November sample. These are different limitations: falling evidence is not the same as missing evidence. Neither justifies claiming that a useful workflow has stopped working.
Evaluate a proposal against a specific business problem rather than the category’s momentum. Require evidence of an accepted result before expanding spending. The index supports caution about buying the wave; it does not establish that every product in it should be rejected.
What this means for the next budget
The strongest combined reading is that higher expectations, variable tool bills and demands for proof are meeting in the same budget. Treating each as a separate project risks approving activity without establishing whether it helps the revenue team deliver.
- Define the outcome first. State whether the initiative is intended to recover stalled deals, improve quota delivery, or retain and expand revenue. Keep unmeasured benefits labeled as assumptions.
- Price the workflow, not just the license. Account for usage charges and agree how spending will be controlled before scaling.
- Assign responsibility before automation. Identify who owns the customer data, approves system changes and accepts the result.
- Separate a pattern from a watch item. Coaching, agent write rules and pipeline without additional SDRs remain thinner signals in this report. They warrant investigation, not a claim that their payoff has been established.
How much confidence to place in the findings
November covers November 1 to 13 only. Its targeted search included 36 posts from 35 authors. That is a partial, selected body of public discussion, not a representative survey of revenue leaders. The report also describes a wider October 14 to November 13 rerun with 111 posts from 93 authors; the two windows should not be confused.
October receives the report’s highest confidence; September and November’s customer-data, engineering and credit-pricing findings receive medium confidence. January to May and months marked thin receive lower confidence. Do not reverse October priorities on the strength of 13 days of November evidence.
The supplied PDF names Forrester, Gartner, BCG, Axios and Reuters; labeled vendor sources include Salesloft, D&B, LeanData, DealHub, HubSpot and Clay. Community evidence comes from Reddit and X. These sources serve different purposes: survey summaries provide reported findings, pricing material describes offers, and public discussion identifies concerns. They are not interchangeable samples.
The PDF refers to source links in speaker notes, but those links are not included in the supplied file. The cited names and dates are preserved from the report, not independently re-verified here. HubSpot’s September 16 and October 1 packaging, October 21 credit discussion, a November 5 customer-success claim, and some Forrester and LeanData references remain unverified or not re-checked. They should not anchor a purchasing decision.
There are also TikTok and YouTube coverage gaps and no measured company-size or industry rankings. The report is a directional planning aid, not a census, a causal study or a forecast. The original PDF retains the detailed source and confidence notes.
Monthly scores: accessible data
| Revenue pain | Jan | Feb | Mar | Apr | May | Jun | Jul | Aug | Sep | Oct | Nov |
|---|---|---|---|---|---|---|---|---|---|---|---|
| Comp and quota planning | 72 | 74 | 76 | 70 | Not enough data | 76 | Not enough data | 75 | 82 | 85 | 66 |
| Tool credit and seat pricing | Not enough data | 48 | 70 | 72 | Not enough data | 64 | 66 | 70 | 78 | 88 | 86 |
| AI plan the board will believe | 62 | 65 | 58 | 66 | 72 | 64 | 70 | 68 | 78 | 86 | 74 |
| CRM data not ready for AI | Not enough data | 55 | 58 | 62 | 74 | 72 | 66 | 68 | 70 | 84 | 80 |
| GTM engineer, who builds AI | Not enough data | 52 | 60 | 62 | Not enough data | Not enough data | 70 | 72 | 76 | 83 | 84 |
| AEO and AI-assisted buyers | 68 | 72 | 68 | 70 | 76 | 80 | 70 | 66 | 62 | 52 | Not enough data |
| Forecast the board trusts | Not enough data | Not enough data | 58 | Not enough data | Not enough data | 55 | Not enough data | Not enough data | 72 | 78 | 72 |
| Win rates and stalled deals | 66 | 55 | Not enough data | Not enough data | Not enough data | Not enough data | Not enough data | Not enough data | 72 | 68 | 66 |
| Headcount cuts versus revenue | 55 | 62 | 52 | 50 | 72 | Not enough data | 60 | 58 | 60 | 70 | 64 |
| AI SDRs as a category | Not enough data | Not enough data | Not enough data | 70 | 72 | 62 | 56 | 55 | 48 | 40 | 36 |
| Managers who cannot coach | Not enough data | Not enough data | 50 | Not enough data | Not enough data | Not enough data | 55 | 58 | 52 | 66 | Not enough data |
| Agent ownership, write rules | Not enough data | Not enough data | Not enough data | Not enough data | Not enough data | Not enough data | 55 | Not enough data | 50 | 68 | 60 |
| Pipeline without more SDRs | Not enough data | Not enough data | Not enough data | 58 | Not enough data | Not enough data | 60 | Not enough data | Not enough data | 68 | 55 |
Keep the report
The complete 21-page PDF, including original charts and confidence notes.
Download report (PDF)