
Where AI Attention Is Going: Exact X Counts for 35 AI Terms, October 2026
By Jonathan Kvarfordt · Published · Updated
Exact X API counts for 35 AI, agent and go-to-market terms, Oct 2–7, 2026. Models and agent tools carry the big numbers. Revenue vocabulary sits at the edge.
TLDR
What this research does. This page counts English posts on X for 35 AI, agent and go-to-market terms, Oct 2 to 7, 2026, from exact X API counts, and publishes every number with the method and its limits.
Why it matters to you. It shows where AI attention sits right now and how small the revenue vocabulary is inside it, so you can weigh vendor proposals against measured attention before you change a plan.
The short answer
What does the research show about Where AI Attention Is Going: Exact X Counts for 35 AI Terms, October 2026?
Evidence
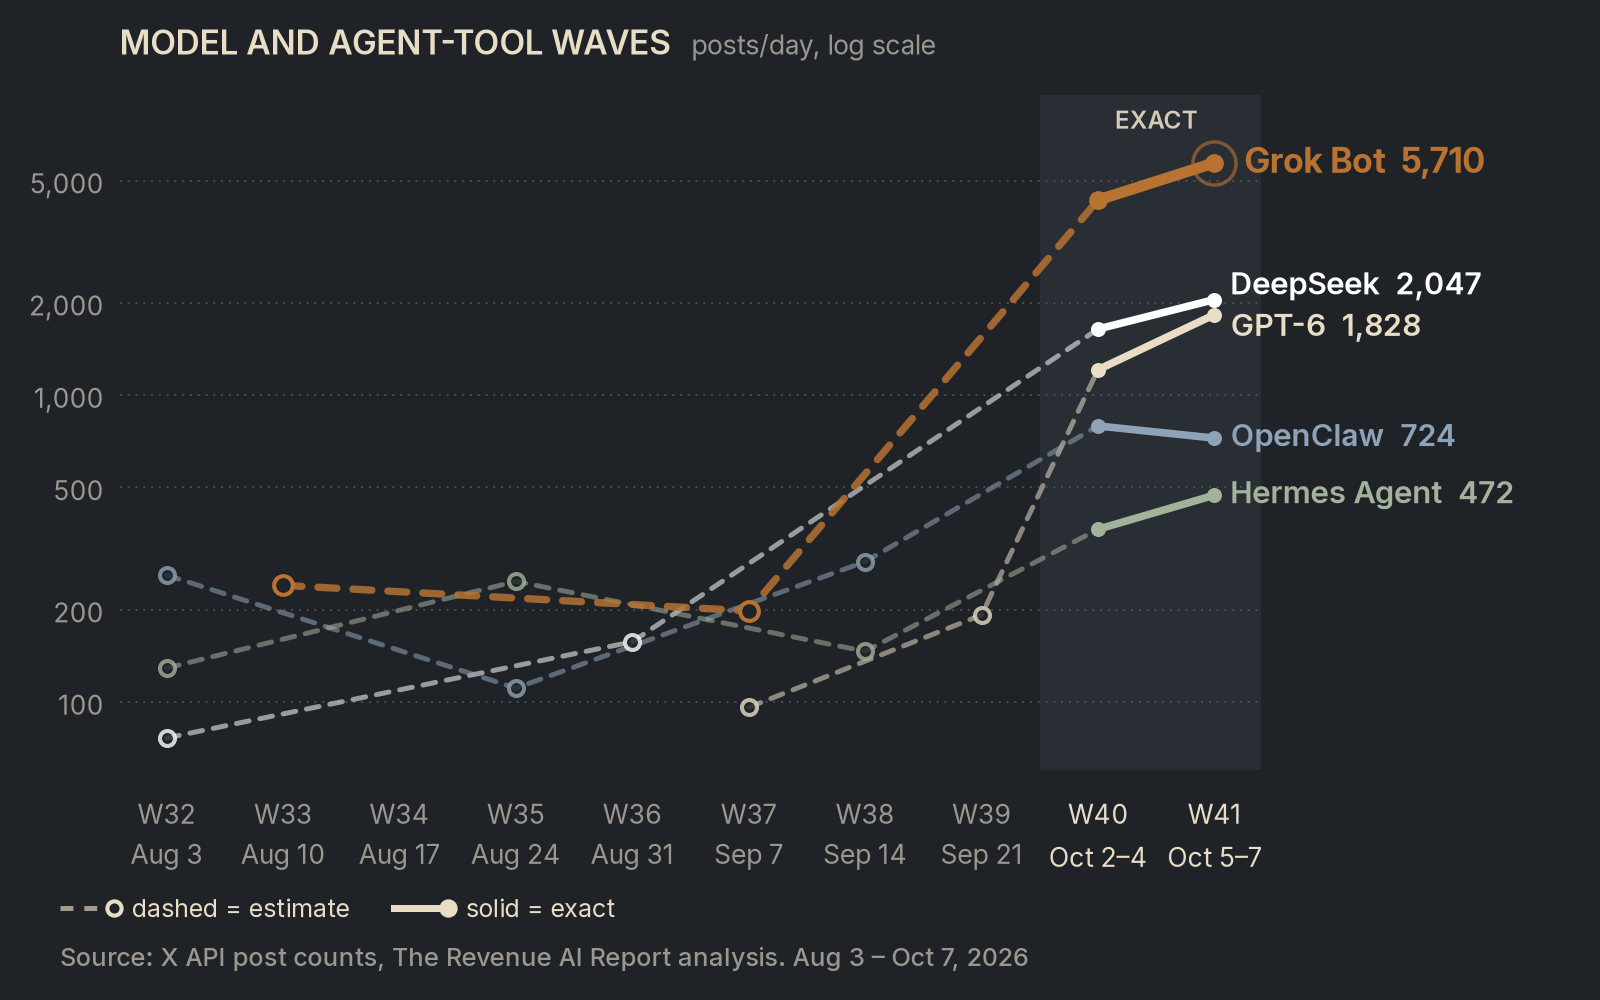
- Grok Bot averaged 5,710 English posts a day on X for Oct 5–7, 2026, up 32% from 4,321 for Oct 2–4. Some of that volume is spam.
- DeepSeek averaged 2,047 posts a day, GPT-6 1,828, OpenClaw 724 and Hermes Agent 472 for Oct 5–7.
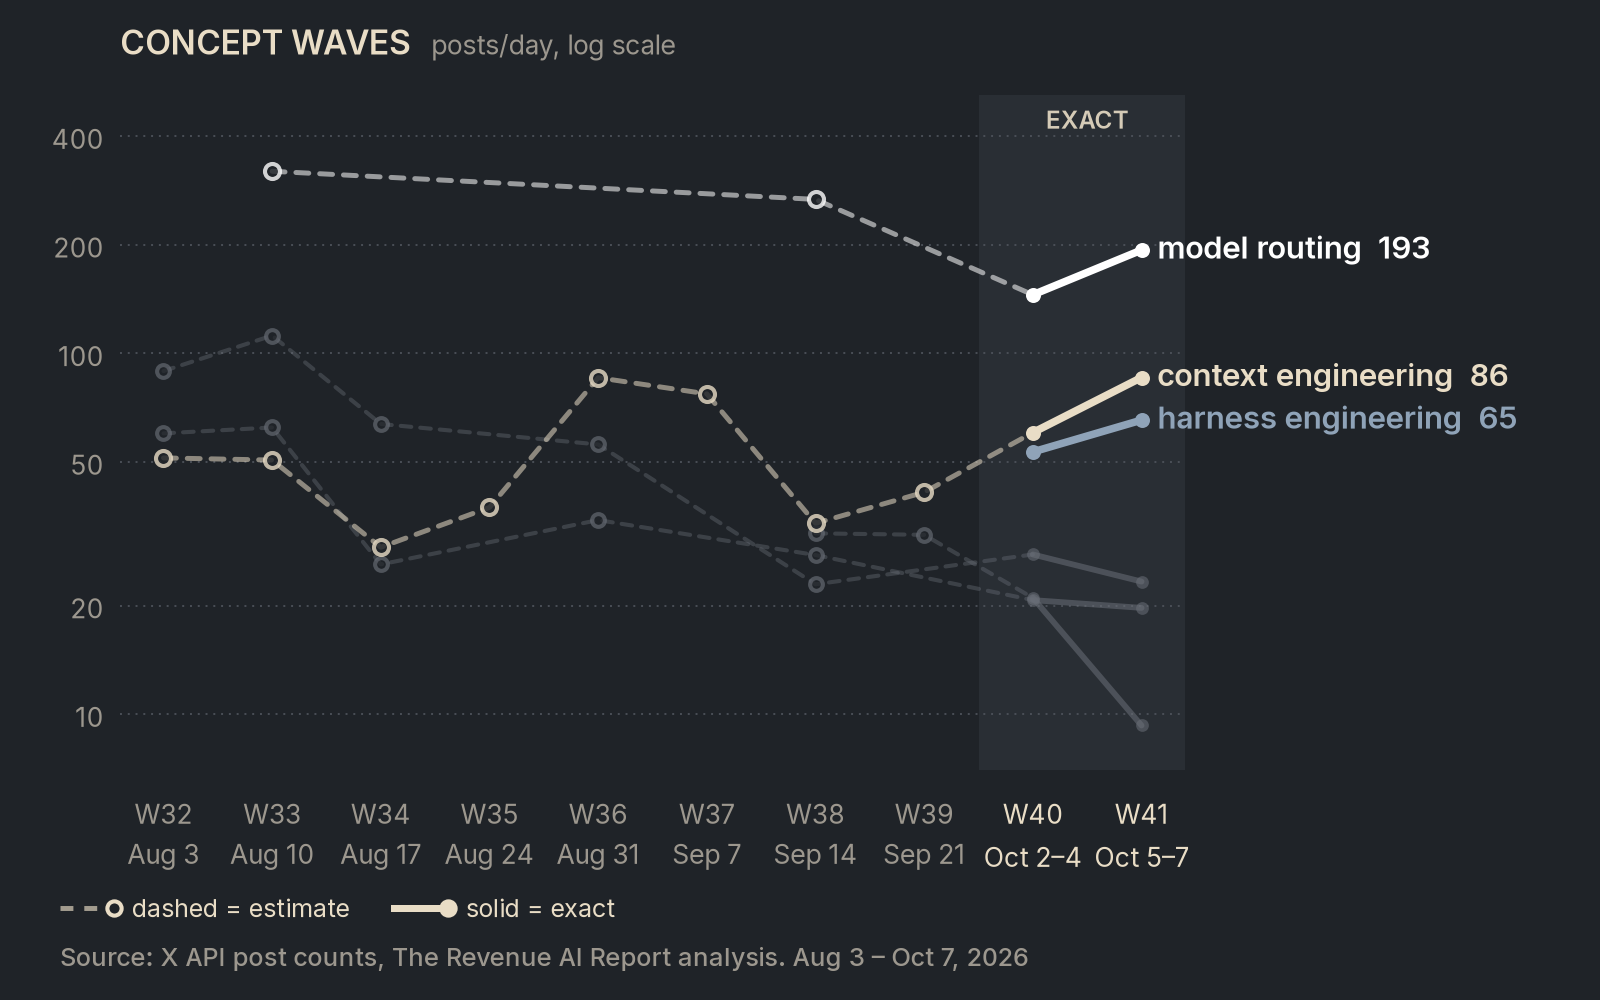
- Model routing drew 193 posts a day for Oct 5–7. Context engineering drew 86 and harness engineering 65.
Supporting pages
- Dictionary plain-language definitions
Grok Bot drew 5,710 English posts a day on X from Oct 5 to 7. The phrase "AI SDR" drew 21. The AI conversation runs on models and agent tools, and revenue vocabulary sits at its edge. Here are the exact counts behind our X trend wave chart.
Read the companion analysis: GTM Engineer AI Trends: Exact X Counts, October 2026.
What the counts show
Every number in this section is an exact count from the X API: English posts and replies, retweets excluded, full UTC days.
1. Grok Bot leads all 35 terms. It averaged 5,710 posts a day for Oct 5–7, up 32% from 4,321 for Oct 2–4. Oct 7 alone hit 8,893. Some of that volume is spam: copied webinar posts and memecoin promotion.
2. Models and agent tools carry the big numbers. DeepSeek averaged 2,047 posts a day, GPT-6 1,828, OpenClaw 724 and Hermes Agent 472.
3. Model routing is the largest concept term on the chart. "Model routing" and its variants drew 193 posts a day. Context engineering drew 86 and harness engineering 65. Builders are talking about which model should handle which job.
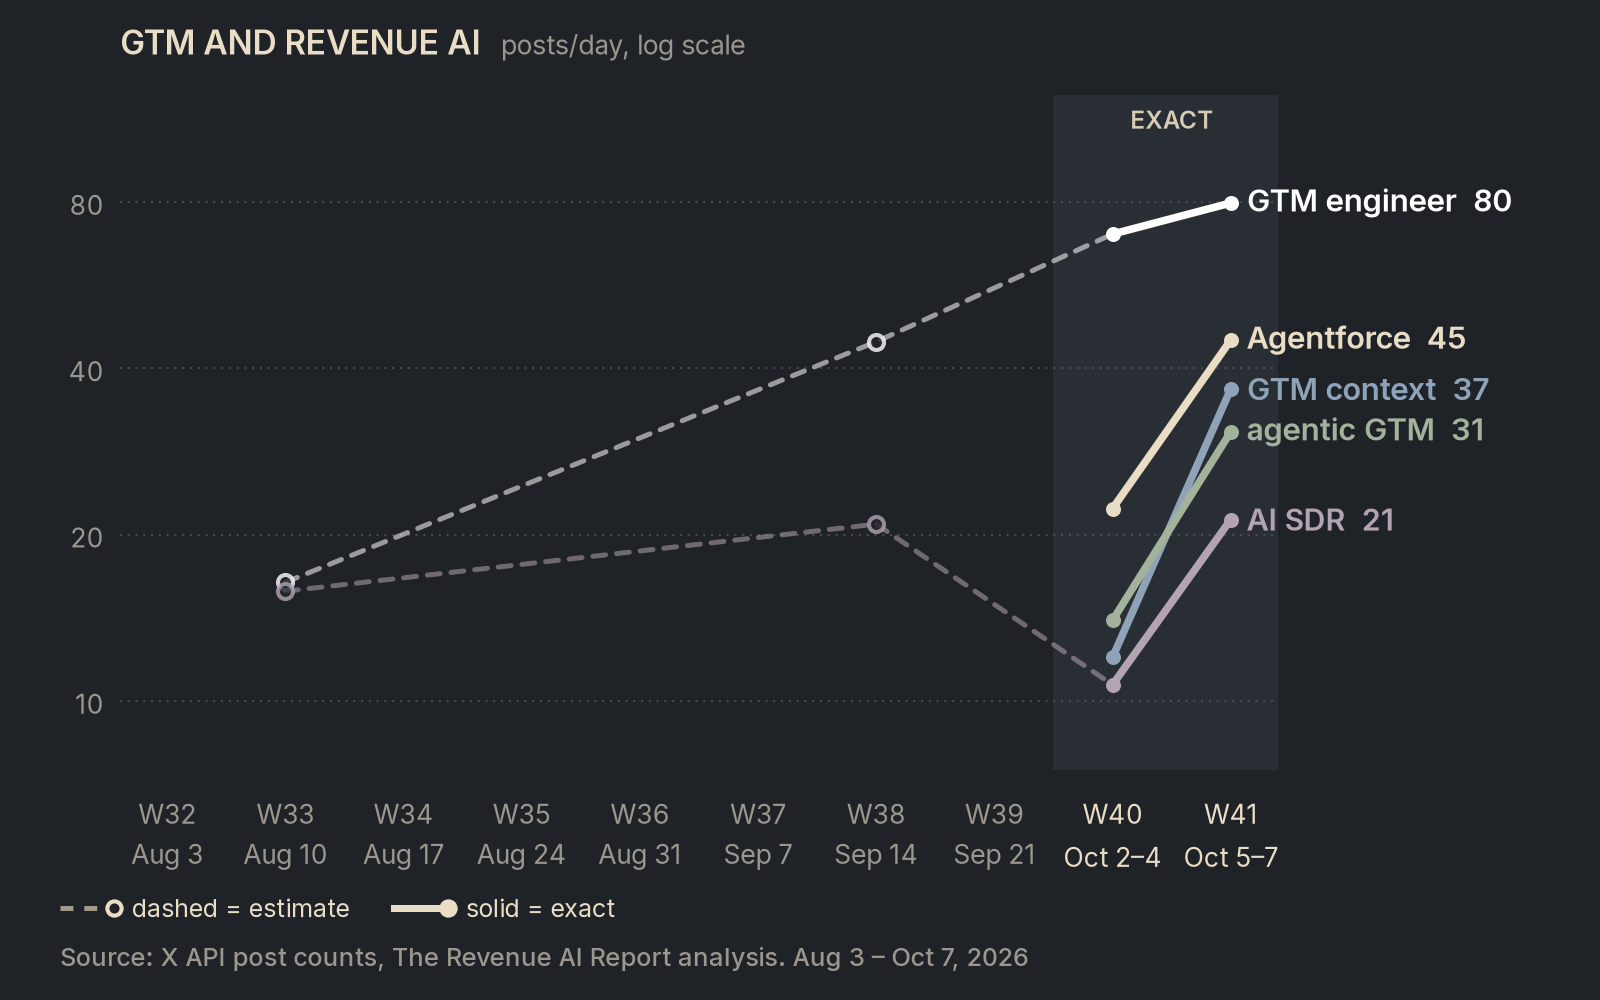
4. GTM engineer is the one human job title among the 35 terms. It drew 80 posts a day for Oct 5–7 and 70 for Oct 2–4. Small.
5. Revenue vocabulary is small. GTM context drew 37 posts a day, agentic GTM 31 and AI SDR 21. The GTM context search also catches some crypto posts. A few dozen posts a day is a few dozen people.
What this means for revenue leaders
- Your engineers and vendors watch models and agent tools. Expect the next proposals on your desk to name them.
- Model routing is a cost decision. Ask each AI vendor which model runs each step, who picks it, and what each step costs.
- GTM engineer is the role the conversation names. Decide who owns building and wiring agents on your team, and give that person a budget line.
- Terms at 21 to 80 posts a day are weak signals. Re-check them before you change a plan.
The data: all 35 terms
Mean posts per day on X, English, no retweets, replies included. Exact counts from the X API, UTC days. Sorted by Oct 5–7.
| # | Term | Group | Oct 5–7 mean/day | Oct 2–4 mean/day |
|---|---|---|---|---|
| 1 | Grok Bot | Agent tool | 5,710 | 4,321 |
| 2 | Claude Opus 5.5 | Model | 5,342 | 4,952 |
| 3 | Claude Code | Agent tool | 4,117 | 3,642 |
| 4 | DeepSeek (V4 family) | Model | 2,047 | 1,641 |
| 5 | GPT-6 | Model | 1,828 | 1,209 |
| 6 | Jev (TypeSafe System One) | Model | 1,794 | 1,907 |
| 7 | agent skills / subagents | Concept | 974 | 865 |
| 8 | Claude Haiku 5.5 | Model | 894 | 64 |
| 9 | OpenClaw | Agent tool | 724 | 793 |
| 10 | personal agents | Concept | 717 | 413 |
| 11 | Grok 4.7 | Model | 597 | 513 |
| 12 | agentic commerce | GTM | 594 | 425 |
| 13 | Hermes Agent | Agent tool | 472 | 365 |
| 14 | OpenAI Intelligent UI / Decisions API | Agent tool | 455 | 88 |
| 15 | Meta Muse | Agent tool | 380 | 446 |
| 16 | OpenAI dots | Agent tool | 266 | 366 |
| 17 | model routing | Concept | 193 | 145 |
| 18 | sponsored agents / ChatGPT ads | GTM | 147 | 34 |
| 19 | DeepSeek Harness | Agent tool | 119 | 144 |
| 20 | context engineering | Concept | 86 | 60 |
| 21 | GTM engineer | GTM | 80 | 70 |
| 22 | WebMCP | Agent tool | 66 | 46 |
| 23 | harness engineering | Concept | 65 | 53 |
| 24 | Clay Sculpt / revenue engine | GTM | 53 | 39 |
| 25 | Agentforce | GTM | 45 | 22 |
| 26 | GTM context / context graph | GTM | 37 | 12 |
| 27 | agentic GTM / GTM agents | GTM | 31 | 14 |
| 28 | graph engineering | Concept | 23 | 28 |
| 29 | AI SDR | GTM | 21 | 11 |
| 30 | loop engineering | Concept | 20 | 21 |
| 31 | agent inbox / command center | Agent tool | 19 | 15 |
| 32 | Open Knowledge Format | Agent tool | 18 | 9.7 |
| 33 | jev engineering | Concept | 9.3 | 21 |
| 34 | revenue agents | GTM | 9.0 | 6.3 |
| 35 | Cursor Origin | Agent tool | 6.7 | 2.7 |
Download the daily counts (CSV). Daily exact counts for Oct 2 to 7, 2026, for all 35 terms, plus both three-day means. Licensed CC BY 4.0: reuse it with attribution to The Revenue AI Report.
Method and limits
How we counted. On Oct 8, 2026, about 12:00 to 1:10 PM MT, we pulled exact daily post counts for each term from the X API recent counts endpoint. Each query was the term plus -is:retweet lang:en: English posts and replies, retweets excluded. The endpoint reaches back seven days, so we averaged full UTC days into two means, Oct 2–4 and Oct 5–7. For the chart's earlier weeks, Aug 3 to Sep 27, we pulled up to 10 recent archive posts at each week's end and converted their time span into a posting rate.
Limits.
- W40 and W41 are partial weeks. The W40 point covers Oct 2–4 only. The W41 point covers Oct 5–7 only.
- The "GTM context" search also catches OriginTrail crypto posts. Its query includes "context graph," a phrase OriginTrail posts use.
- Some terms have only two exact data points. 23 of the 35 terms have no earlier samples, so their trend rests on two three-day means. On the chart, harness engineering, GTM context and agentic GTM show two points each.
- Some Grok Bot volume is spam, mostly copied webinar posts and memecoin promotion.
- Earlier weeks are sampled estimates. They landed within about 50% of exact counts in a check and undercount high-volume terms, so part of the jump into W40 on the chart is method. We report no growth figures from those weeks.
- Phrase search can match quoted text. Short terms such as "jev" catch unrelated posts.
Also in the record
Figures that sit alongside these charts.
- Grok Bot averaged 5,710 English posts a day on X for Oct 5–7, 2026, up 32% from 4,321 for Oct 2–4. Some of that volume is spam.
- DeepSeek averaged 2,047 posts a day, GPT-6 1,828, OpenClaw 724 and Hermes Agent 472 for Oct 5–7.
- Model routing drew 193 posts a day for Oct 5–7. Context engineering drew 86 and harness engineering 65.
- GTM engineer drew 80 posts a day for Oct 5–7 and 70 for Oct 2–4.
- GTM context drew 37 posts a day, agentic GTM 31 and AI SDR 21 for Oct 5–7.
Questions this page answers
What the data says, in plain language.
- What AI term drew the most posts on X in early October 2026?
- Grok Bot. Of 35 AI terms tracked, it drew the most English posts on X: a mean of 5,710 a day for Oct 5–7, 2026, up 32% from 4,321 for Oct 2–4 (exact X API counts). Some volume is spam.
- How often do people post about GTM engineers on X?
- "GTM engineer" drew a mean of 80 English posts a day on X for Oct 5–7, 2026, and 70 a day for Oct 2–4 (exact X API counts, retweets excluded).
- How much does X talk about model routing?
- Posts using "model routing," "model router" or "multi-model routing" averaged 193 a day for Oct 5–7, 2026. Context engineering averaged 86 and harness engineering 65.
- How were these numbers collected?
- The Revenue AI Report pulled exact daily counts from the X API recent counts endpoint on Oct 8, 2026 (English, retweets excluded) and averaged full UTC days for Oct 2–4 and Oct 5–7. Earlier chart weeks are sampled estimates.
Cite this page
Permanent URL and suggested citation.
https://www.therevenueaireport.com/research/x-trend-waves-revenue-ai-2026-10
The Revenue AI Report, "Where AI Attention Is Going: Exact X Counts for 35 AI Terms, October 2026," October 8, 2026. https://www.therevenueaireport.com/research/x-trend-waves-revenue-ai-2026-10
The counts on this page are original data from The Revenue AI Report, pulled from the X API. Cite this page, and link the CSV when you reuse the data.
Sources
Every publisher used on this page.
If a metric, model term, or method on this page is unfamiliar, every one of them is defined in The AI and Revenue Dictionary. Sample size, field date, and confidence tags are explained there too.
X API, recent post counts endpoint
Exact daily counts for each of the 35 terms, pulled Oct 8, 2026, about 12:00 to 1:10 PM MT. Query: the term plus -is:retweet lang:en, so English posts and replies, retweets excluded. UTC days, Oct 2 to 7, 2026.
https://docs.x.com/x-api/posts/get-count-of-recent-postsThe Revenue AI Report, daily counts dataset (CSV)
Daily exact counts for Oct 2 to 7, 2026, for all 35 terms, plus the Oct 2–4 and Oct 5–7 means. Published under CC BY 4.0.
https://www.therevenueaireport.com/data/x-trend-waves-2026-10.csv
Could not confirm
What we looked for and did not find.
Claims found during research and not charted
- Growth for Aug 3 to Sep 27. The earlier weekly points on the charts are sampled estimates that undercount high-volume terms, so this page reports no growth figures from those weeks.
How to cite this research
Written by Jonathan Kvarfordt, Founder and Principal Analyst, The Revenue AI Report. Published under CC BY 4.0.
APA
Kvarfordt, J. (2026). Where AI Attention Is Going: Exact X Counts for 35 AI Terms, October 2026. The Revenue AI Report. Retrieved from https://www.therevenueaireport.com/research/x-trend-waves-revenue-ai-2026-10
MLA
Kvarfordt, Jonathan. "Where AI Attention Is Going: Exact X Counts for 35 AI Terms, October 2026." The Revenue AI Report, 8 Oct. 2026, www.therevenueaireport.com/research/x-trend-waves-revenue-ai-2026-10.
BibTeX
@misc{kvarfordt2026xtrendwavesrevenueai202610,
  author = {Kvarfordt, Jonathan},
  title = {Where AI Attention Is Going: Exact X Counts for 35 AI Terms, October 2026},
  year = {2026},
  publisher = {The Revenue AI Report},
  url = {https://www.therevenueaireport.com/research/x-trend-waves-revenue-ai-2026-10}
}Subscribe
Want the next count?
Get the Report and see the next X trend scan when it publishes.
Get the Report →