
Job Loss, Fact or Fiction?
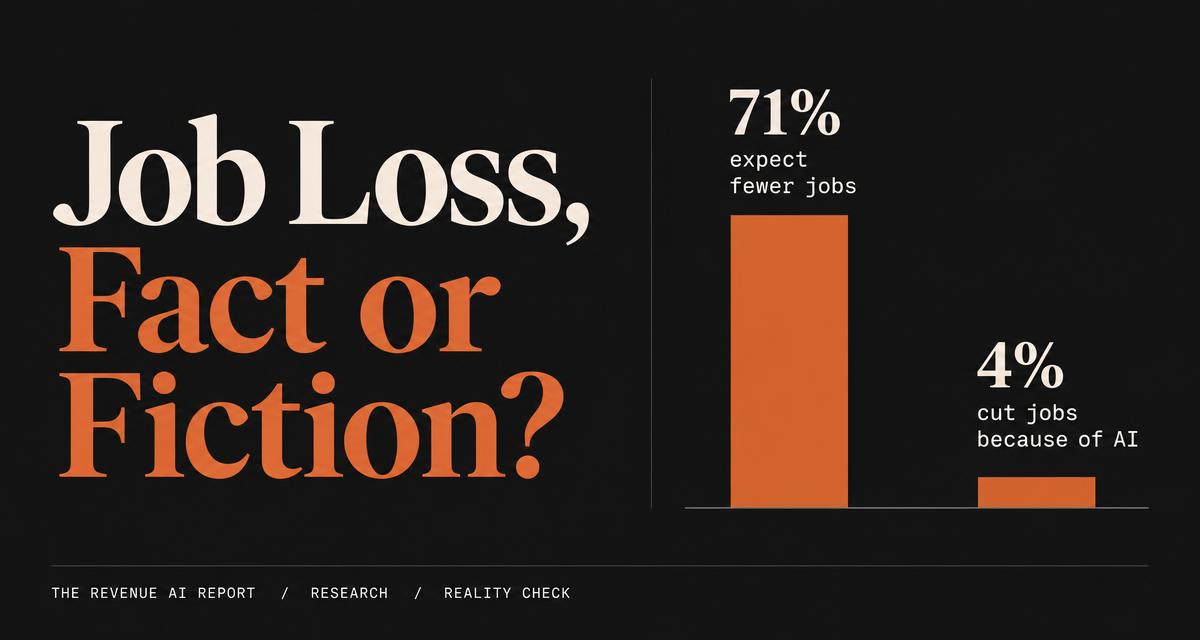
Seven in ten Americans now expect AI to shrink the job market. The payroll data, the residency match, the postings index and the Fed's own surveys describe a different economy. This piece measures the gap, lists the losses honestly, and gives each GTM seat one job.
The short answer
What does the research show about Job Loss, Fact or Fiction??
Evidence
- 71% of US adults expect AI to lead to fewer jobs over the next 20 years and 5% expect more jobs. Among adults 18 to 29 the fewer-jobs share is 73%, up from 61% in 2024.
- 61% of service firms in the New York Fed's district used AI in 2026, against 40% in 2025 and 25% in 2024. 4% laid anyone off because of AI in the previous six months, 15% hired fewer workers because of AI, and 13% hired more.
- Workers aged 22 to 25 in the two most AI-exposed occupation quintiles saw employment fall about 11% from November 2022 to June 2026, while their least-exposed peers rose about 10% and total ADP employment rose 6%.
Supporting pages
- Dictionary plain-language definitions
In 2016 Geoffrey Hinton told a machine-learning audience in Toronto that AI would outperform humans at radiology within five years, ten at most, and that training new radiologists should stop. Ten years later the United States has about 10% more active radiologists than it did when he said it, 4,333 open radiologist listings that take an average of 130 days to fill, and an average radiologist salary of $571,000, up 9% in a year. The 2026 residency match offered 1,478 radiology positions, up from 1,412 in 2025, and filled 97.6% of them.
That is the pattern this report is about. On September 17, 2026 the Pew Research Center published a 37-country survey in which more people expect AI to reduce jobs than to create them in 34 of 37 countries. In the US the fewer-jobs share is 71%, up seven points in two years, and only 5% of Americans expect AI to create more jobs.
The sentiment is real and it is measured well. The question this report asks is whether the labor data has moved anywhere near as far as the fear has. Across the sources assembled below, it has not. The losses that have happened are concentrated, nameable, and mostly delivered through hiring that never occurred, and the transformation of existing jobs is running far ahead of their elimination.
Two things are true at once, and the Report holds both. Specific work has already been lost: translators, freelance writers and designers, customer service representatives and junior sales development roles have documented, measurable declines tied to AI. And the broad displacement that the sentiment implies has not shown up: the Yale Budget Lab's tracker, updated September 15, 2026, finds the occupational mix is not changing in ways that align with AI, and Goldman Sachs Research says no significant AI-led change in the US employment mix has appeared in labor data.
This piece builds on The Task Fallacy, which showed that Anthropic's extreme scenario reaches 17.9% cognitive unemployment only when the reinstatement effect is set to zero. That article covered the model. This one covers the people, the predictions that failed, the losses that did not, the three horizons ahead, and what each GTM seat does about it.
Expectation
71%
The Revenue AI Report · September 2026
Measured
4%
The Revenue AI Report · September 2026
Entry gate
-11%
The Revenue AI Report · September 2026
Projection
+15.8%
The Revenue AI Report · September 2026
Cuts
-41%
The Revenue AI Report · September 2026
The gap, stated plainly. Seventy-one percent of Americans expect fewer jobs. Four percent of service firms in the Fed's district have cut anyone because of AI. The Challenger count attributes 22% of announced cuts to AI in a year when total announced cuts are down 41%. The BLS projects the single largest occupational gain in the country for the job most often named as doomed. None of that means the fear is irrational. The Stanford numbers show a specific group carrying a specific cost.
Figure 2. Opinion and fact over the same two-year window
Three opinion series moved 7, 12 and 15 points. The one measured AI-attributed layoff series moved 3 points, from 1% to 4%.
- US adults expecting fewer jobs7 pts
- Adults 18 to 29 expecting fewer jobs12 pts
- Americans 18 to 34 more concerned than excited15 pts
- Fed district service firms that laid anyone off because of AI3 pts
What this does not say
The gap between the rows is not proof that the fear is wrong. It is the size of the distance between expectation and current measurement.
- Publisher
- Pew Research Center and the Federal Reserve Bank of New York
- Sample and method
- Opinion rows come from Pew's 2024 and 2026 readings. The layoff row comes from the New York Fed's annual AI module for service firms in New York and Northern New Jersey.
- Field dates
- Not published by the source.
The two sides answer different questions. Pew asks about the next 20 years. The Fed row records the past six months at firms in one district.
Figure 3. BLS projected employment change by occupation, 2024 to 2034
The occupation most often named as doomed carries the largest numerical gain in the projection set.
- Data scientists+33.5percent change
- Information security analysts+28.5percent change
- Software developers+15.8percent change
- All occupations+3.1percent change
- Customer service representatives-5.5percent change
- Legal secretaries-5.8percent change
- Procurement clerks-8.7percent change
What this does not say
A projection cannot capture a near-term shock that has not happened yet.
- Publisher
- US Bureau of Labor Statistics
- Sample and method
- Employment projections for 2024 to 2034, published July 2026 in the BLS analysis of artificial intelligence, information technology and employment.
- Field dates
- Not published by the source.
These are projections, not measurements. They assume trend and are revised every two years.
Figure 4. Announced US job cuts, January to August
Total announced cuts fell 41% year over year. AI was the stated reason for 116,175 of the 2026 total, about 22%.
Series
- 2025 total, Jan to Aug892,362announced cuts
- 2026 total, Jan to Aug529,914announced cuts
- 2026 cuts attributed to AI116,175announced cuts
About 22% of the 2026 total
What this does not say
This series cannot show that AI caused any cut. It records the stated reason, and companies have an incentive to name AI.
- Publisher
- Challenger, Gray & Christmas
- Sample and method
- August 2026 job cut announcement report, published September 3, 2026. The series records the reason companies give for their own announced cuts.
- Field dates
- Not published by the source.
AI-attributed cuts fell to fourth place in August 2026 with 3,462, the lowest monthly total since December 2025.
Total announced cuts fell 41% year over year. AI was the stated reason for 116,175 of the 2026 total, about 22%.
| Series | Value (announced cuts) | Note |
|---|---|---|
| 2025 total, Jan to Aug | 892362 | |
| 2026 total, Jan to Aug | 529914 | |
| 2026 cuts attributed to AI | 116175 | About 22% of the 2026 total |
Source: Challenger, Gray & Christmas. August 2026 job cut announcement report, published September 3, 2026. The series records the reason companies give for their own announced cuts. Confidence: High.
Caveat: AI-attributed cuts fell to fourth place in August 2026 with 3,462, the lowest monthly total since December 2025.
What this does not say: This series cannot show that AI caused any cut. It records the stated reason, and companies have an incentive to name AI.
01. What broke
Two named predictions, one attribution problem, and one logical error underneath all of them.
Prediction one: the radiologist
The 2016 claim was that machines would read images better than humans within five to ten years and radiologists would become unnecessary. The first half is partly true. The second half broke on contact with the job.
About three quarters of the roughly 1,400 AI-enabled medical devices cleared by the FDA as of early 2026 are radiology tools. Radiology caseloads rose 25% between 2018 and early 2025. The tools made reading faster, which made imaging cheaper and more useful, which increased the volume of imaging ordered, which increased demand for the licensed human who signs the final read.
The United States now has about 10% more active radiologists than it did in 2016, 4,333 open listings that take an average of 130 days to fill, and an average radiologist salary of $571,000, up 9% in a year.
- The 2026 residency match offered 1,478 radiology positions, up from 1,412 in 2025, and filled 97.6% of them. Diagnostic radiology offered 1,241 positions against 1,132 in 2022, and interventional radiology offered 238, up 42% from 2022.RT Medical, citing NRMP
- The ranks of radiology practitioners are expected to grow 26% or more over the next three decades.Knowable Magazine
- The honest caveat: applicants to diagnostic radiology fell to 1,741 in 2026, down 14% from the 2023 peak of 2,014, and the fill rate slipped from 98.4% to 97.6%.RT Medical
What we think
The prediction failed to reduce the jobs. It may be succeeding at frightening the people who would fill them.
That is the sentiment gap doing damage to the supply side of a shortage. A forecast does not have to be right to change behaviour. It only has to be repeated for a decade to a cohort deciding what to train for.
Prediction two: the software engineer
The 2023 to 2025 version of the claim was that code generation would end the software developer as a category. The evidence runs in three layers, and they disagree with each other.
Layer one is the projection. The BLS expects software developer employment to grow 15.8% from 2024 to 2034, adding 267,700 jobs, the largest numerical gain of any occupation in its AI and IT analysis, alongside data scientists at 33.5% and information security analysts at 28.5%.
Layer two is the postings series, which is where the pain actually lives. Indeed's US software development postings index stood at 76.62 on September 11, 2026, against a February 2020 baseline of 100. It bottomed at 61.1 in May 2025 after peaking at 233.8 in February 2022, and it has now risen for five straight quarters. The shape of that curve is a 2021 to 2022 overhire followed by a rate-driven correction, with recovery under way. AI arrived in the middle of it and absorbed the blame for the whole thing.
Layer three is the entry gate. Workers aged 22 to 25 in the two most AI-exposed occupation quintiles, software engineering among them, saw employment fall about 11% from November 2022 to June 2026 while their peers in the three least-exposed quintiles grew about 10%. Experienced workers in the same occupations show no comparable gap.
- BLS projections for 2024 to 2034 put software developers, data scientists and information security analysts among the leading gainers.BLS
- The Indeed software development postings index, held at FRED, records the trough and the recovery.FRED, Indeed Hiring Lab·Second Talent
- The Stanford authors state the study does not estimate a causal impact of AI on the 22 to 25 cohort.Stanford Digital Economy Lab
- LinkedIn's chief global affairs officer said in April 2026 that LinkedIn data shows hiring down about 20% since 2022 and that on AI's expected employment effects, "we haven't seen it," pointing instead to interest rates.Refonte Learning, citing TechCrunch
What we think
The senior developer is in demand. The junior developer is waiting at a door that opens more slowly than it did.
Those are different problems and they require different responses. Treating them as one story produces both bad policy and bad hiring plans.
What broke in the attribution
Challenger's series is the source most often cited for the claim that AI is now the leading reason for layoffs. Read in full, it says something more specific.
AI's share of announced cuts ran from 7% in January 2026 to about 40% in May, led the monthly reasons from March through July, then fell to fourth in August with 3,462 cuts, the lowest monthly total since December 2025. In the same May that AI was blamed for 40% of announced cuts, US payrolls grew by 172,000.
Companies have an incentive to name AI. The series records the stated reason, not the verified cause.
- Oxford Economics concluded in January 2026 that firms do not appear to be replacing workers with AI on a significant scale, that traditional drivers of layoffs are cited more commonly, and that productivity growth is not accelerating in the way large-scale labor replacement would produce.Oxford Economics
- Amazon cut 14,000 roles in October 2025 and 16,000 in January 2026, and its CEO said the cuts were "not even really AI-driven... It really is culture." Forrester projects 6% of US jobs automated by 2030 and estimates 18 to 24 months to replace one employee with AI.The Guardian
- MIT's NANDA initiative found 95% of enterprise generative AI pilots produced no measurable profit impact. An organization cannot replace a workforce with a pilot that does not return.Fortune
What we think
Attribution is cheap and unaudited. A company that names AI as the reason for a cut gets a modernisation story at no cost, and no reporter can check the agent-handled share because it is never published.
The Report's rule is simple: no role is described as automated until the agent-handled share and the quality metric for that work are measured and shown.
What broke in the logic
The task-equals-job assumption is the machinery under most of the failed predictions.
A job is a bundle of tasks plus accountability, judgment, relationship, and the authority to sign. Automating tasks changes the bundle. It does not remove the person who is accountable for the outcome, which is why the radiologist still signs, the senior engineer still ships, and the Klarna customer can still reach a human.
History has run this experiment before. Between 1988 and 2004, ATMs cut the tellers needed per urban branch from 20 to 13, and urban branches grew 43%, so teller employment did not fall. Roughly 60% of all US work in 2018 sat in job titles that did not exist in 1940, and among professionals the share is 74%. The Census added "Artificial Intelligence Specialist" as a job title in 2000.
- The ATM record is the cleanest historical case of cheaper output producing more output and more accountable humans.Bessen, IMF
- The 1940 to 2018 new-work record quantifies how much of current employment sits in titles that did not exist.Autor, Chin, Salomons and Seegmiller·NBER
What we think
The full version of this argument, including the model that produces a 17.9% cognitive unemployment figure only when the reinstatement effect is set to zero, is in The Task Fallacy.
That piece covered the model. This one covers the people.
02. The honest ledger
The Report does not publish comfort. The following work has been lost, is being lost, or can be lost, with the evidence, the mechanism and a confidence tag for each.
| Work | What the evidence shows | Mechanism | Confidence |
|---|---|---|---|
| Translation and interpretation | A UK Society of Authors 2024 survey found over a third of translators lost assignments to generative AI and 43% reported lower earnings. Oxford research estimates about 28,000 US translator positions were never created because of machine translation between 2010 and 2023. An EU-contract translator reports earnings down about 70%.CNN | Direct substitution of the core output | High |
| Freelance writing, editing and design | After ChatGPT, freelancers in writing occupations on Upwork saw 2% fewer monthly jobs and 5.2% lower monthly earnings. Image freelancers saw similar declines after DALL-E 2 and Midjourney. Higher-rated freelancers were hit harder.CEPR VoxEU | Substitution at the commodity end, where the buyer accepts adequate output | High |
| Customer service representatives | BLS projects -5.5%, or -153,700 jobs, from 2024 to 2034. Salesforce cut support from 9,000 to about 5,000 with agents.BLS·CNBC | Tier-one resolution moved to agents, humans kept for complex and sensitive cases | High |
| Sales development representatives | 36% of more than 560 B2B SaaS companies reduced SDR or BDR headcount in the prior year, 19% increased and 44% held flat, the highest reduction rate of any sales function. Reductions arrive mostly by not backfilling.Stacker, citing The Bridge Group·Refonte Learning | Blanket outbound, templated sequences and list-building automated, and the SDR-to-AE ladder narrows | High that the contraction happened, medium on AI as the cause, since financing and overhiring also moved |
| Entry-level roles in AI-exposed occupations | Ages 22 to 25 down about 11% in the two most exposed quintiles against up about 10% in the three least exposed, November 2022 to June 2026, while total ADP employment rose 6%.Stanford Digital Economy Lab | Reduced hiring, concentrated where AI automates rather than assists | High on the pattern, and the authors decline a causal claim |
| Procurement clerks, legal secretaries, claims adjusters | BLS projects -8.7%, -5.8% and -5.1% respectively from 2024 to 2034. 98% of Glassdoor AI comments from claims adjusters are negative.BLS·Forbes, on Glassdoor data | Document-centric, rules-heavy processing | Medium, because these are projections |
| Management consultants, call centre staff, graphic designers | Goldman Sachs identifies displacement in these groups, described as relatively small against the whole job market. The WEF lists graphic designers among declining roles.Goldman Sachs·World Economic Forum | Output-based work with low switching cost for the buyer | Medium |
- The work that has been lost is work the buyer could accept at good-enough quality without a relationship.
- The losses have arrived mostly as hiring that did not happen, which is why they are hard to see in the layoff data and easy to feel if you are 24.
- In every case where the buyer cared about accountability or the cost of a mistake, a human stayed in the loop, and in several cases a human was brought back.
03. Three horizons
Each horizon carries the forecast, the evidence it rests on, and the marker that would prove it wrong. The Report will revisit these markers on the record.
Horizon 1 · 1 to 2 years, through 2028
Transformation outpaces elimination
Job transformation outpaces job elimination by a wide margin. The aggregate unemployment effect stays small. Losses concentrate at the entry gate and in the commodity tiers of support, content, translation and outbound sales. Attribution of layoffs to AI stays inflated relative to what firms can show they have actually automated. At least three more named reversals join the ledger as companies discover the cost side of the replacement math.
Evidence
- The Fed's district data shows 61% adoption with 4% AI-attributed layoffs and one third retraining.New York Fed
- Denmark's administrative records rule out earnings or hours effects above 2% two years after chatbot adoption.Becker Friedman Institute
- Klarna has already reversed once and, in August 2026, committed that customers must always have the option to speak to a human while its assistant handles about two thirds of inquiries.Outsource Accelerator
- IBM announced it was tripling entry-level hiring in February 2026, and Salesforce said in April 2026 it was hiring 1,000 new graduates and interns to build Agentforce.Fortune
What would prove it wrong
- US unemployment among recent college graduates above 7.5% for two consecutive quarters.
- The Indeed software postings index falling back below 65.
- AI-attributed cuts above 40% of Challenger's total for three consecutive months while total payrolls contract.
Horizon 2 · 3 to 5 years, 2029 to 2031
Redefinition becomes visible in the org chart
The redefinition of roles becomes visible in titles and org charts. Six of the eight GTM seats will have different job descriptions than they had in 2024, with the same or higher headcount in most of them. The market bifurcates by quality: top performers and white-glove service earn a premium, adequate performers in automatable tiers are squeezed, and the middle empties. Cumulative displacement approaches the lower end of the Goldman Sachs base case of 6 to 7% of workers over a decade, spread across a transition rather than arriving as a shock. New categories of work, including evaluation, orchestration and AI operations, absorb a large share of the people who would once have been junior specialists.
Evidence
- The WEF employer survey projects 22% of jobs disrupted by 2030, 170 million created and 92 million displaced, and 39% of on-the-job skills changing.World Economic Forum
- The BLS projects +3.1% total employment, with software developers, data scientists and security analysts leading gains and clerical and support roles leading declines.BLS
- The Fed's district firms are already training for current roles rather than new ones, which is transformation showing up before reallocation.New York Fed
What would prove it wrong
- Aggregate US unemployment rising more than one full point with AI exposure as the dominant explanatory variable in the Yale or Stanford series.
- BLS revising software developer growth to flat or negative.
- The Challenger AI share settling above 50% across a full year.
Horizon 3 · 5 to 10 years, 2031 to 2036
The buyer picks the path, per transaction
The Autor pattern holds. A large share of GTM work in 2036 will sit in titles that do not exist today, the way 60% of 2018 work sat in titles that did not exist in 1940. Every product category will offer the buyer a fully machine-served path and a human path, and the buyer will choose per transaction. The humans still selling in any category will be the ones who are measurably excellent and who deliver a level of care the machine cannot, and they will be paid more for it than their predecessors were. The largest labor risk in this horizon is a supply problem: too few people trained for the human-judgment roles that remain, because a decade of fear coverage steered them away, as the radiology applicant decline already hints.
Evidence
- Goldman Sachs expects data centre and power buildout alone to require roughly 500,000 net new US jobs by 2030 and counts 216,000 construction jobs added since 2022 in exposed trades.Goldman Sachs
- The ATM record, the 1940 to 2018 record and the radiology record all show the same shape: cheaper output, more output, more people accountable for it.Bessen, IMF·Autor et al.
What would prove it wrong
- Prime-age labor force participation falling more than two points with AI as the identified driver.
- A full product category, such as mortgage origination, B2B software procurement or residential brokerage, where the human path drops below 10% of transactions and the machine path shows equal or better satisfaction and regret scores.
04. The buyer's level
The product of the next decade sits at the buyer's level of control, and buyers will pick the better experience, human or machine, every time.
Gartner's 2025 survey of 632 B2B buyers found 61% prefer an overall rep-free buying experience, 73% actively avoid suppliers who send irrelevant outreach, and 69% report inconsistencies between what the website says and what the seller says. Gartner's broader research puts the rep-free preference at 75%, and the same body of work finds that self-service digital purchases are far more likely to end in regret, while buyers who use digital tools in partnership with a rep are 1.8 times more likely to complete a high-quality deal.
Buyers want the machine for research, comparison and speed. They want a human for context, intangibles, negotiation, and the moments when a mistake is expensive. Gartner's own breakdown says buyers prefer self-service when searching for general information and prefer seller input when determining whether a product fits their company. The seller who survives is the one the buyer chooses at that second moment.
Gartner, rep-free buying survey·Gartner, the B2B buying journey
The real estate test
Residential real estate is the cleanest natural experiment available, because the buyer has had a machine-served path for two decades. Listings went online. Valuation models arrived. Zillow Offers put an algorithm in the seller's chair and wound down in November 2021 with a $421.6 million pre-tax segment loss, as recorded in the Reversal Ledger. Opendoor kept going and, in Q2 2026, purchased 149% more homes than a year earlier and expects positive adjusted net income by year-end. The machine path exists, works, and is growing.
The human path did not shrink. For-sale-by-owner transactions fell to 5% of home sales, an all-time low, down from 21% in 1985 and 7% a year earlier, and a record 91% of sellers used an agent. The median FSBO sale price was $360,000 against $425,000 for agent-assisted sales, an 18% gap, though FSBO homes differ in ways that make the gap only partly attributable to the agent. Eighty-six percent of sellers said their agent handled most aspects of the sale and 87% said they would recommend their agent. Among sellers who tried to go it alone, more than half called the process stressful, 43% admitted legal mistakes, and about one in five eventually hired an agent.
Information abundance did not remove the agent. It raised the standard the agent has to meet. Everyone competing in the middle of that market is competing against a machine on the machine's terms, and the buyer will make the rational choice.
National Association of Realtors·Opendoor Q2 2026
The general rule
Klarna's assistant handles about two thirds of inquiries with 82% faster response times and 25% fewer repeat issues, and Klarna now guarantees the human option because the cost-only version produced lower quality. Salesforce cut 4,000 support roles and said it was hiring thousands of salespeople in the same breath. In each case the machine took the tier where the buyer did not want a person and the person moved to the tier where the buyer did.
For GTM this reduces to a single operating principle: give the buyer the machine path by default, make it excellent, and staff the human path only with people the buyer would choose over the machine. Mediocre human service is the category that is actually being replaced, and it should be.
05. The measurement stack
The series a GTM leader needs to read this question monthly, with what each one can and cannot say.
| Series | Cadence | What it measures | What it cannot say |
|---|---|---|---|
| Challenger, Gray & Christmas job cut report | Monthly, first week | Announced cuts and the reason companies give | Whether AI caused the cut. It records the stated reason |
| Indeed software development postings index, at FRED | Daily | Postings volume by sector against February 2020 | Hires, headcount, or the cause of the change |
| Stanford Digital Economy Lab, Canaries in the Coal Mine | Periodic updates on ADP payroll | Employment by age and AI exposure | Causation. The authors say so |
| Yale Budget Lab AI labor tracker | Regular updates | Occupational mix and exposure against unemployment | Firm-level or role-level effects |
| New York Fed regional business surveys, AI module | Annual AI module, August | Adoption, investment depth, layoffs, hiring and retraining | National totals. It covers New York and Northern New Jersey |
| New York Fed labor market for recent college graduates | Quarterly | Recent graduate unemployment and underemployment | AI attribution |
| Pew Research Center AI surveys | Periodic | Public expectation and concern | Anything about actual employment |
| BLS Employment Projections | Every two years | Ten-year occupational projections | Near-term shocks. Projections assume trend |
Reading rule: any claim that AI is eliminating jobs at scale should be able to show up in at least two of the top four series at once. As of September 2026, it shows up in one, Stanford, for one age band, and in the stated-reason field of another, Challenger.
06. The playbook steal
Four moves the Report would copy from organizations getting the transition right, with the receipt for each.
Steal 1
Retrain before you replace, and publish the ratio
Just over one third of AI-using service firms in the Fed's district retrain workers, against 4% laying anyone off, and the training is concentrated on doing the current job better, verifying AI output and following data-security protocol. Only 36% of US workers say they have the training they need, down from 45% a year earlier, and 56% say their employer never consulted them about how AI tools are used in their work. Workers with a lot of influence over how workplace technology is used are more than twice as likely to report high job satisfaction. The consultation is the cheapest intervention on this list and the least practiced.
New York Fed·Jobs for the FutureSteal 2
Guarantee the human option and price it as a feature
Klarna's second reversal is the template: keep the assistant on the two thirds it handles well, guarantee a human for the rest, and recruit that human tier for quality rather than cost. Gartner's regret data says the buyer will pay for it.
Outsource Accelerator·GartnerSteal 3
Move the people, not just the budget
Salesforce reduced support from 9,000 to about 5,000 and redeployed the savings into sales hiring, and by April 2026 was hiring 1,000 graduates and interns to build the agent platform itself. The Report does not endorse the layoff. It records that the headcount went to the tier the buyer values.
CNBC·FortuneSteal 4
Protect the entry gate on purpose
IBM's CHRO put it on the record in February 2026: the companies three to five years from now that are going to be the most successful are those that doubled down on entry-level hiring in this environment. NACE found employers planned to increase class-of-2026 hiring by 5.6%. The SDR-to-AE ladder is narrowing, with internal promotion rates from SDR to AE down significantly. The firm that keeps a redesigned entry role will own the senior talent pool in 2031.
Fortune·Stacker, citing The Bridge Group
07. The eight-seat read
For each seat: what is actually being automated, the one action to take this quarter, who owns it, and what done looks like.
CRO and sales
ExposureBlanket outbound, list-building, templated sequencing and first-touch qualification are automated now, and the SDR contraction is the evidence. Discovery on complex deals, multi-threaded consensus, negotiation and accountability for the outcome are not, and Gartner's 1.8x high-quality-deal finding says the buyer still wants a human there.
ActionSplit the funnel into a machine path and a human path by deal complexity and buyer familiarity, and staff the human path only with reps who clear a published quality bar.
OwnerCRO, with RevOps building the routing
DoneEvery inbound and outbound motion has a documented path assignment. Human-path reps have a scorecard the buyer's own feedback feeds. The first cohort of SDR roles has been redesigned as pipeline-quality or deal-desk roles rather than eliminated.
Marketing
ExposureCommodity content production, first-draft copy, image generation and translation are the most substituted work in the ledger. Positioning, original research, brand judgment and the decision about what deserves to be said are not, and buyers say they actively avoid irrelevant outreach.
ActionMove the team's measured output from volume to evidence: fewer assets, each with a receipt, and a named human editor accountable for every claim.
OwnerCMO or head of marketing
DoneA content ledger showing asset count down, sourced-claim share up, and buyer-side engagement per asset up over one quarter. Every AI-drafted asset carries a named human sign-off.
RevOps and GTM engineering
ExposureReport building, data hygiene, enrichment and routing logic are being absorbed by agents. System design, evaluation of agent output and ownership of the human-path handoff are new work with rising demand.
ActionStand up the measurement stack in section 06 internally: a monthly one-page read of postings, headcount, agent-handled share and human-path escalation rate for your own funnel.
OwnerHead of RevOps or GTM engineering
DoneThe one-pager ships monthly to the executive team with a stated confidence tag on every number and a rule for what would change a staffing decision.
Enablement
ExposureStatic training content and certification quizzes are automatable. Coaching to a quality bar, teaching judgment and running the entry-level ramp are not, and the Fed's finding that only a third of firms retrain shows how much room there is.
ActionRebuild the entry ramp around the human-path skills that buyers choose: discovery, context, negotiation and verification of AI output.
OwnerHead of enablement
DoneA published ramp with a quality gate that new hires must pass before touching the human path, time-to-gate tracked, and the training question asked internally each quarter with the yes share rising.
Customer success
ExposureTier-one resolution, status updates and basic onboarding are the clearest documented substitution in the ledger, with BLS projecting -153,700 customer service roles. Expansion, renewal risk on complex accounts, executive relationships and the bad-news call are where the human path holds.
ActionAdopt the Klarna rule: the machine handles the two thirds it handles well, and every customer can always reach a named human.
OwnerHead of CS
DoneHuman reachability is a published SLA. Escalation-to-human rate, repeat-issue rate and NRR are reported side by side. The CS org chart shows headcount moved into expansion and executive coverage.
Partnerships and BD
ExposurePartner sourcing, directory research and deal-registration paperwork are automatable. Trust between two organizations, joint account planning and conflict resolution are not, and these are the highest-context conversations in GTM.
ActionReallocate time freed from research into a fixed cadence of in-person or live joint planning with the top partners.
OwnerHead of partnerships
DoneResearch hours per partner down, live planning sessions per top partner up, and partner-sourced pipeline reported quarterly against the prior year.
Founder and executive
ExposureThe founder's exposure is the narrative. Attributing cuts to AI is cheap and, as Amazon's own CEO conceded, often inaccurate, and it feeds the sentiment gap that Pew is measuring.
ActionAdopt a disclosure rule: no role is described as automated internally or externally until the agent-handled share and the quality metric for that work are measured and shown.
OwnerCEO
DoneA written internal standard for AI attribution, every workforce change announced in the past year re-tagged against it, and the consultation question asked once and the result acted on.
Finance
ExposureFinance is both automatable in its own clerical tiers, with procurement clerks projected at -8.7%, and the seat that approves the replacement math. Forrester's 18 to 24 months to replace one employee, and MIT NANDA's 95% no-return rate, say the math is usually wrong.
ActionRequire a total-cost model for any headcount reduction attributed to AI, including implementation time, quality loss, escalation cost and the rehiring risk documented in the Reversal Ledger.
OwnerCFO
DoneA standard replacement-math template in use, every AI-attributed headcount change in the plan with a completed template attached, and a twelve-month lookback on prior cuts showing realized savings against modeled savings.
08. Reversal Ledger, new rows
The Report maintains a running ledger of announced AI replacements that were walked back. Two rows are added with this piece.
Klarna
August 2026
Second reversal on the record. After a year of AI-first support and the May 2025 walkback, Klarna committed that customers must always have the option to speak to a human, kept the assistant on about two thirds of inquiries, and began recruiting human agents under a flexible model, with the CEO stating that cost as the dominant factor produced lower quality.
Outsource Accelerator·Fortune, on the first reversalAmazon
February 2026
Attribution reversal. After 14,000 cuts in October 2025 and 16,000 in January 2026 widely reported as AI-driven, the CEO stated the cuts were not even really AI-driven and that it really is culture.
The Guardian
The full ledger, with IBM Watson at MD Anderson, Zillow Offers, DPD, Air Canada, McDonald's with IBM, Duolingo, Cursor and Klarna's first reversal, lives in The Reversal Ledger and in The Task Fallacy.
09. Method, limits and citation
This piece compares measured sentiment with measured labor series. Sentiment comes from published surveys. Labor data comes from government statistics, central bank surveys, academic studies, an announced-cuts series and a job postings index. Company cases are taken from company statements and first-party reporting.
Limits: survey questions about a 20-year horizon cannot be tested against two years of data, and the page says so rather than treating the gap as a refutation. The announced-cuts series records stated reasons, not verified causes. The Stanford cohort finding is a pattern, and the authors decline a causal claim. BLS figures are projections. Figure 1 charts five of Pew's 37 country values, the ones named in the cited coverage.
Firewall note: no sponsor, partner or former employer of the Report appears as a case or a source in this piece. Of the 40 sources listed below, 25, or 63%, are independent primary sources: government, central bank, academic, industry body, or company first-party.
License: CC BY 4.0. You may share and adapt this work with attribution. Individual source material remains subject to its original publisher's terms.
The reply prompt
Name one role on your GTM team that was cut, left unfilled, or redefined in the last twelve months, and tell the Report what the buyer noticed. Replies that include a number will be aggregated, anonymized, and published as the first-party follow-up to this piece. Write to hello@revenueaireport.com.
Also in the record
Figures that sit alongside these charts.
- 71% of US adults expect AI to lead to fewer jobs over the next 20 years and 5% expect more jobs. Among adults 18 to 29 the fewer-jobs share is 73%, up from 61% in 2024.
- 61% of service firms in the New York Fed's district used AI in 2026, against 40% in 2025 and 25% in 2024. 4% laid anyone off because of AI in the previous six months, 15% hired fewer workers because of AI, and 13% hired more.
- Workers aged 22 to 25 in the two most AI-exposed occupation quintiles saw employment fall about 11% from November 2022 to June 2026, while their least-exposed peers rose about 10% and total ADP employment rose 6%.
- Denmark's administrative records produce a precise null: effects larger than 2% on earnings or hours are ruled out two years after chatbot adoption.
- Goldman Sachs' base case is 6 to 7% of US workers displaced over a roughly ten-year transition, raising unemployment by about 0.6 of a point.
- Glassdoor reviews mentioning AI rose 240% between May 2025 and May 2026, and 53% were negative. The positive share fell from 81% in 2019 to 43% in 2026.
- Only 36% of US workers say they have the AI training and resources they need, down from 45% a year earlier, and 56% say their employer never consulted them about how AI tools are used in their work.
Questions this page answers
What the data says, in plain language.
- What does the research show about Job Loss, Fact or Fiction??
- Seven in ten Americans now expect AI to shrink the job market. The payroll data, the residency match, the postings index and the Fed's own surveys describe a different economy. This piece measures the gap, lists the losses honestly, and gives each GTM seat one job. In 2016 Geoffrey Hinton told a machine-learning audience in Toronto that AI would outperform humans at radiology within five years, ten at most, and that training new radiologists should stop. Ten years later the United States has about 10% more active radiologists than it did when he said it, 4,333 open radiologist listings that take an average of 130 days to fill, and an average radiologist salary of $571,000, up 9% in a year. The 2026 residency match offered 1,478 radiology positions, up from 1,412 in 2025, and filled 97.6% of them.
- What does the figure "Figure 1. Share expecting AI to mean fewer jobs, selected countries" show?
- Pew surveyed 37 countries. The values charted here are the ones published as named figures in the coverage this page cites, plus the 37-country median. Source: Pew Research Center. 37-country survey published September 17, 2026, asking whether AI will lead to fewer jobs, more jobs, or not much difference over the next 20 years. Confidence: High. Caveat: This chart shows five of the 37 published values, the ones named in the sources cited on this page. It is not the full Pew ranking.
- What does the figure "Figure 2. Opinion and fact over the same two-year window" show?
- Three opinion series moved 7, 12 and 15 points. The one measured AI-attributed layoff series moved 3 points, from 1% to 4%. Source: Pew Research Center and the Federal Reserve Bank of New York. Opinion rows come from Pew's 2024 and 2026 readings. The layoff row comes from the New York Fed's annual AI module for service firms in New York and Northern New Jersey. Confidence: High. Caveat: The two sides answer different questions. Pew asks about the next 20 years. The Fed row records the past six months at firms in one district.
- What does the figure "Figure 3. BLS projected employment change by occupation, 2024 to 2034" show?
- The occupation most often named as doomed carries the largest numerical gain in the projection set. Source: US Bureau of Labor Statistics. Employment projections for 2024 to 2034, published July 2026 in the BLS analysis of artificial intelligence, information technology and employment. Confidence: Medium. Caveat: These are projections, not measurements. They assume trend and are revised every two years.
- What does the figure "Figure 4. Announced US job cuts, January to August" show?
- Total announced cuts fell 41% year over year. AI was the stated reason for 116,175 of the 2026 total, about 22%. Source: Challenger, Gray & Christmas. August 2026 job cut announcement report, published September 3, 2026. The series records the reason companies give for their own announced cuts. Confidence: High. Caveat: AI-attributed cuts fell to fourth place in August 2026 with 3,462, the lowest monthly total since December 2025.
- What else sits alongside these figures?
- 71% of US adults expect AI to lead to fewer jobs over the next 20 years and 5% expect more jobs. Among adults 18 to 29 the fewer-jobs share is 73%, up from 61% in 2024. 61% of service firms in the New York Fed's district used AI in 2026, against 40% in 2025 and 25% in 2024. 4% laid anyone off because of AI in the previous six months, 15% hired fewer workers because of AI, and 13% hired more. Workers aged 22 to 25 in the two most AI-exposed occupation quintiles saw employment fall about 11% from November 2022 to June 2026, while their least-exposed peers rose about 10% and total ADP employment rose 6%. Denmark's administrative records produce a precise null: effects larger than 2% on earnings or hours are ruled out two years after chatbot adoption.
- Where does this data come from?
- Every figure is reproduced from a named publisher: Pew Research Center, Pew Research Center, young adults, USA Today, Jobs for the Future, Forbes, on Glassdoor data, The Revenue AI Report research library. Sample, field date, and confidence are shown on each chart. Sources marked as vendor research are labelled on the page.
- What could not be confirmed?
- A causal estimate of AI's effect on the 22 to 25 cohort. The Stanford authors explicitly decline a causal claim, so the 11% gap is charted as a pattern and not as an effect size. A verified agent-handled share behind any AI-attributed layoff. Challenger records the reason a company gives. No company in this research published the automation share and quality metric that would support the attribution. The full 37-country Pew ranking as individual values. Only the named figures in the cited coverage are charted here, so Figure 1 shows five values rather than all 37. A total-cost model for AI headcount replacement from any company that announced one. Forrester's 18 to 24 month estimate is the closest public figure and it is an analyst estimate, not a company disclosure.
Cite this page
Permanent URL and suggested citation.
https://www.therevenueaireport.com/research/job-loss-fact-or-fiction
Kvarfordt, Jonathan. "Job Loss, Fact or Fiction?." The Revenue AI Report, Research Library. https://www.therevenueaireport.com/research/job-loss-fact-or-fiction
Figures on this page are reproduced from the publishers listed below. Cite the original publisher for the underlying data, and this page for the compilation and framing.
Sources
Every publisher used on this page.
If a metric, model term, or method on this page is unfamiliar, every one of them is defined in The AI and Revenue Dictionary. Sample size, field date, and confidence tags are explained there too.
Pew Research Center
37-country survey on AI and jobs, published September 17, 2026, including the 71% US fewer-jobs share.
https://www.pewresearch.org/global/2026/09/17/globally-more-people-expect-ai-to-cause-job-loss-than-growth/Pew Research Center, young adults
Short read on rising AI wariness among young adults in the US, August 18, 2026.
https://www.pewresearch.org/short-reads/2026/08/18/young-adults-in-the-us-are-increasingly-wary-of-ai-concerned-it-will-take-jobs/USA Today
Coverage of the Pew survey findings on expected job loss.
https://www.usatoday.com/story/tech/news/2026/09/17/pew-study-ai-job-loss/91765287007/Jobs for the Future
Worker survey on AI anxiety, training availability and employer consultation, March 11, 2026.
https://www.jff.org/newsroom/press-releases/worker-anxiety-over-ai-is-growing-and-employers-arent-preparing-employees-for-whats-next-new-survey-finds/Forbes, on Glassdoor data
Analysis of a 240% rise in AI mentions in Glassdoor reviews and the negative share, September 1, 2026.
https://www.forbes.com/sites/rachelwells/2026/09/01/ai-mentions-surge-240-at-work-most-are-negative-glassdoor-finds/The Revenue AI Report research library
Coverage measurement used for the fear-versus-works comparison.
https://www.therevenueaireport.com/researchThe Revenue AI Report, The Task Fallacy
The model analysis this piece builds on, including the reinstatement-ratio finding.
https://www.therevenueaireport.com/research/task-fallacyFortune
Account of the 2016 Hinton radiology prediction and the current radiologist supply, salary and vacancy figures.
https://fortune.com/2026/05/04/godfather-of-ai-geoffrey-hinton-radiologists-future-of-work-tech-ai-job-anxiety/Knowable Magazine
Analysis of AI-enabled radiology devices and long-run practitioner growth.
https://knowablemagazine.org/content/article/health-disease/2026/ai-wont-replace-radiologists-but-will-change-their-jobsRT Medical, citing NRMP
2026 radiology match data, including positions offered, fill rates and applicant counts.
https://rtmedical.com.br/en/match-day-radiology-2026/US Bureau of Labor Statistics
AI, information technology and employment projections, 2024 to 2034, published July 2026.
https://www.bls.gov/opub/ted/2026/artificial-intelligence-information-technology-and-employment-2024-34.htmFRED, Indeed Hiring Lab
US software development job postings index, February 2020 baseline.
https://fred.stlouisfed.org/series/IHLIDXUSTPSOFTDEVESecond Talent
Analysis of the software postings recovery, citing Indeed Hiring Lab, September 11, 2026.
https://www.secondtalent.com/resources/the-future-of-software-engineering-jobs-in-2026-what-hiring-managers-need-to-know/Stanford Digital Economy Lab
Canaries in the Coal Mine, August 2026 update, on employment by age and AI exposure.
https://digitaleconomy.stanford.edu/app/uploads/2026/08/Canaries_August2026.pdfFederal Reserve Bank of New York
The labor market for recent college graduates, unemployment and underemployment series.
https://www.newyorkfed.org/research/college-labor-marketYale Budget Lab
Tracking the impact of AI on the labor market, updated September 15, 2026.
https://budgetlab.yale.edu/research/tracking-impact-ai-labor-marketBecker Friedman Institute
Humlum and Vestergaard, large language models and small labor market effects, Danish administrative records.
https://bfi.uchicago.edu/working-papers/large-language-models-small-labor-market-effects/New York Fed, Liberty Street Economics
Businesses are using AI to transform work, not cut jobs, September 2026 district survey module.
https://libertystreeteconomics.newyorkfed.org/2026/09/businesses-are-using-ai-to-transform-work-not-cut-jobs/Challenger, Gray & Christmas
August 2026 job cut announcement report, including AI-attributed cuts and hiring plans.
https://www.challengergray.com/wp-content/uploads/2026/09/Challenger-Report-August-2026.pdfCNBC
Coverage of the Challenger series when AI led the stated reasons for cuts, June 5, 2026.
https://www.cnbc.com/2026/06/05/ai-is-now-the-leading-reason-companies-give-for-cutting-jobs-says-new-report-what-that-means-for-workers.htmlThe Guardian
Reporting on AI washing in layoff attribution, including the Amazon CEO statement and Forrester estimates.
https://www.theguardian.com/us-news/2026/feb/08/ai-washing-job-losses-artificial-intelligenceOxford Economics
Assessment that evidence of an AI-driven shakeup of job markets is patchy, January 7, 2026.
https://www.oxfordeconomics.com/resource/evidence-of-an-ai-driven-shakeup-of-job-markets-is-patchy/Goldman Sachs Research
Base case for displacement, unemployment effect and buildout employment, March 18, 2026.
https://www.goldmansachs.com/insights/articles/how-will-ai-affect-the-us-labor-marketWorld Economic Forum
Future of Jobs Report 2025 employer survey on roles created, displaced and disrupted.
https://www.weforum.org/press/2025/01/future-of-jobs-report-2025-78-million-new-job-opportunities-by-2030-but-urgent-upskilling-needed-to-prepare-workforces/Autor, Chin, Salomons and Seegmiller
New Frontiers, the origins and content of new work, 1940 to 2018.
https://economics.mit.edu/sites/default/files/2023-12/New%20Frontiers%20-%20The%20Origins%20and%20Content%20of%20New%20Work%201940-2018.pdfNBER Working Paper 30389
Working paper version of the new-work analysis, August 2022.
https://www.nber.org/system/files/working_papers/w30389/w30389.pdfJames Bessen, IMF Finance & Development
Toil and Technology, the ATM and bank teller record.
https://www.imf.org/external/pubs/ft/fandd/2015/03/bessen.htmGartner
2025 survey of 632 B2B buyers on rep-free preference and irrelevant outreach.
https://www.gartner.com/en/newsroom/press-releases/2025-06-25-gartner-sales-survey-finds-61-percent-of-b2b-buyers-prefer-a-rep-free-buying-experienceGartner, the B2B buying journey
Research on self-service regret and the 1.8x high-quality-deal finding.
https://www.gartner.com/en/sales/insights/b2b-buying-journeyNational Association of Realtors
FSBO share at an all-time low, price gap and seller satisfaction data, November 11, 2025.
https://www.nar.realtor/news/real-estate-news/fsbos-reach-all-time-low-more-sellers-rely-on-agentsOpendoor TechnologiesVendor research
Q2 2026 results, including homes purchased and the path to positive adjusted net income.
https://investor.opendoor.com/news-releases/news-release-details/q2-2026-open-house-everything-more-contracts-more-revenue-more/Fortune
Klarna's first AI support reversal, May 9, 2025.
https://fortune.com/2025/05/09/klarna-ai-humans-return-on-investment/Outsource Accelerator
Klarna reintroducing human support, August 28, 2026.
https://news.outsourceaccelerator.com/klarna-reintroduces-human-support/CNBC
Salesforce support headcount reduction with agents, September 2, 2025.
https://www.cnbc.com/2025/09/02/salesforce-ceo-confirms-4000-layoffs-because-i-need-less-heads-with-ai.htmlFortune
Salesforce hiring 1,000 new graduates and interns, April 27, 2026.
https://fortune.com/2026/04/27/salesforce-ceo-marc-benioff-hiring-1000-new-grads-ai-jobs/CNN
Translators among the first to feel AI's impact on jobs, January 23, 2026.
https://edition.cnn.com/2026/01/23/tech/translation-language-jobs-ai-automation-intlCEPR VoxEU
Hui, Reshef and Zhou on short-term employment effects for online freelancers, December 2023.
https://cepr.org/voxeu/columns/artificial-intelligence-and-its-short-term-effects-employmentStacker and ZoomInfo
Analysis of GTM careers at entry level, citing The Bridge Group, August 13, 2026.
https://abc17news.com/stacker-business-economy/2026/08/13/ai-is-reshaping-gtm-careers-especially-at-entry-level/Refonte Learning
SDR hiring analysis citing Emergence Capital and Benchmarkit, August 19, 2026.
https://www.refontelearning.com/blog/sdr-hiring-ai-native-companies-buck-slumpFortune
MIT NANDA finding that 95% of enterprise generative AI pilots produced no measurable profit impact.
https://fortune.com/2025/08/18/mit-report-95-percent-generative-ai-pilots-at-companies-failing-cfo/
Could not confirm
What we looked for and did not find.
Claims found during research and not charted
- A causal estimate of AI's effect on the 22 to 25 cohort. The Stanford authors explicitly decline a causal claim, so the 11% gap is charted as a pattern and not as an effect size.
- A verified agent-handled share behind any AI-attributed layoff. Challenger records the reason a company gives. No company in this research published the automation share and quality metric that would support the attribution.
- The full 37-country Pew ranking as individual values. Only the named figures in the cited coverage are charted here, so Figure 1 shows five values rather than all 37.
- A total-cost model for AI headcount replacement from any company that announced one. Forrester's 18 to 24 month estimate is the closest public figure and it is an analyst estimate, not a company disclosure.
How to cite this research
Written by Jonathan Kvarfordt, Founder and Principal Analyst, The Revenue AI Report. Published under CC BY 4.0.
APA
Kvarfordt, J. (2026). Job Loss, Fact or Fiction?. The Revenue AI Report. Retrieved from https://www.therevenueaireport.com/research/job-loss-fact-or-fiction
MLA
Kvarfordt, Jonathan. "Job Loss, Fact or Fiction?." The Revenue AI Report, 31 Aug. 2026, www.therevenueaireport.com/research/job-loss-fact-or-fiction.
BibTeX
@misc{kvarfordt2026joblossfactorfiction,
  author = {Kvarfordt, Jonathan},
  title = {Job Loss, Fact or Fiction?},
  year = {2026},
  publisher = {The Revenue AI Report},
  url = {https://www.therevenueaireport.com/research/job-loss-fact-or-fiction}
}Next theme
What the AI-in-Revenue Discourse Is Actually Saying, September 2026Six cross-vendor patterns beneath the launches, pricing changes, practitioner complaints and hiring data, and the question almost nobody is asking.
Subscribe