
Pick the AI Payback Metric Before Launch
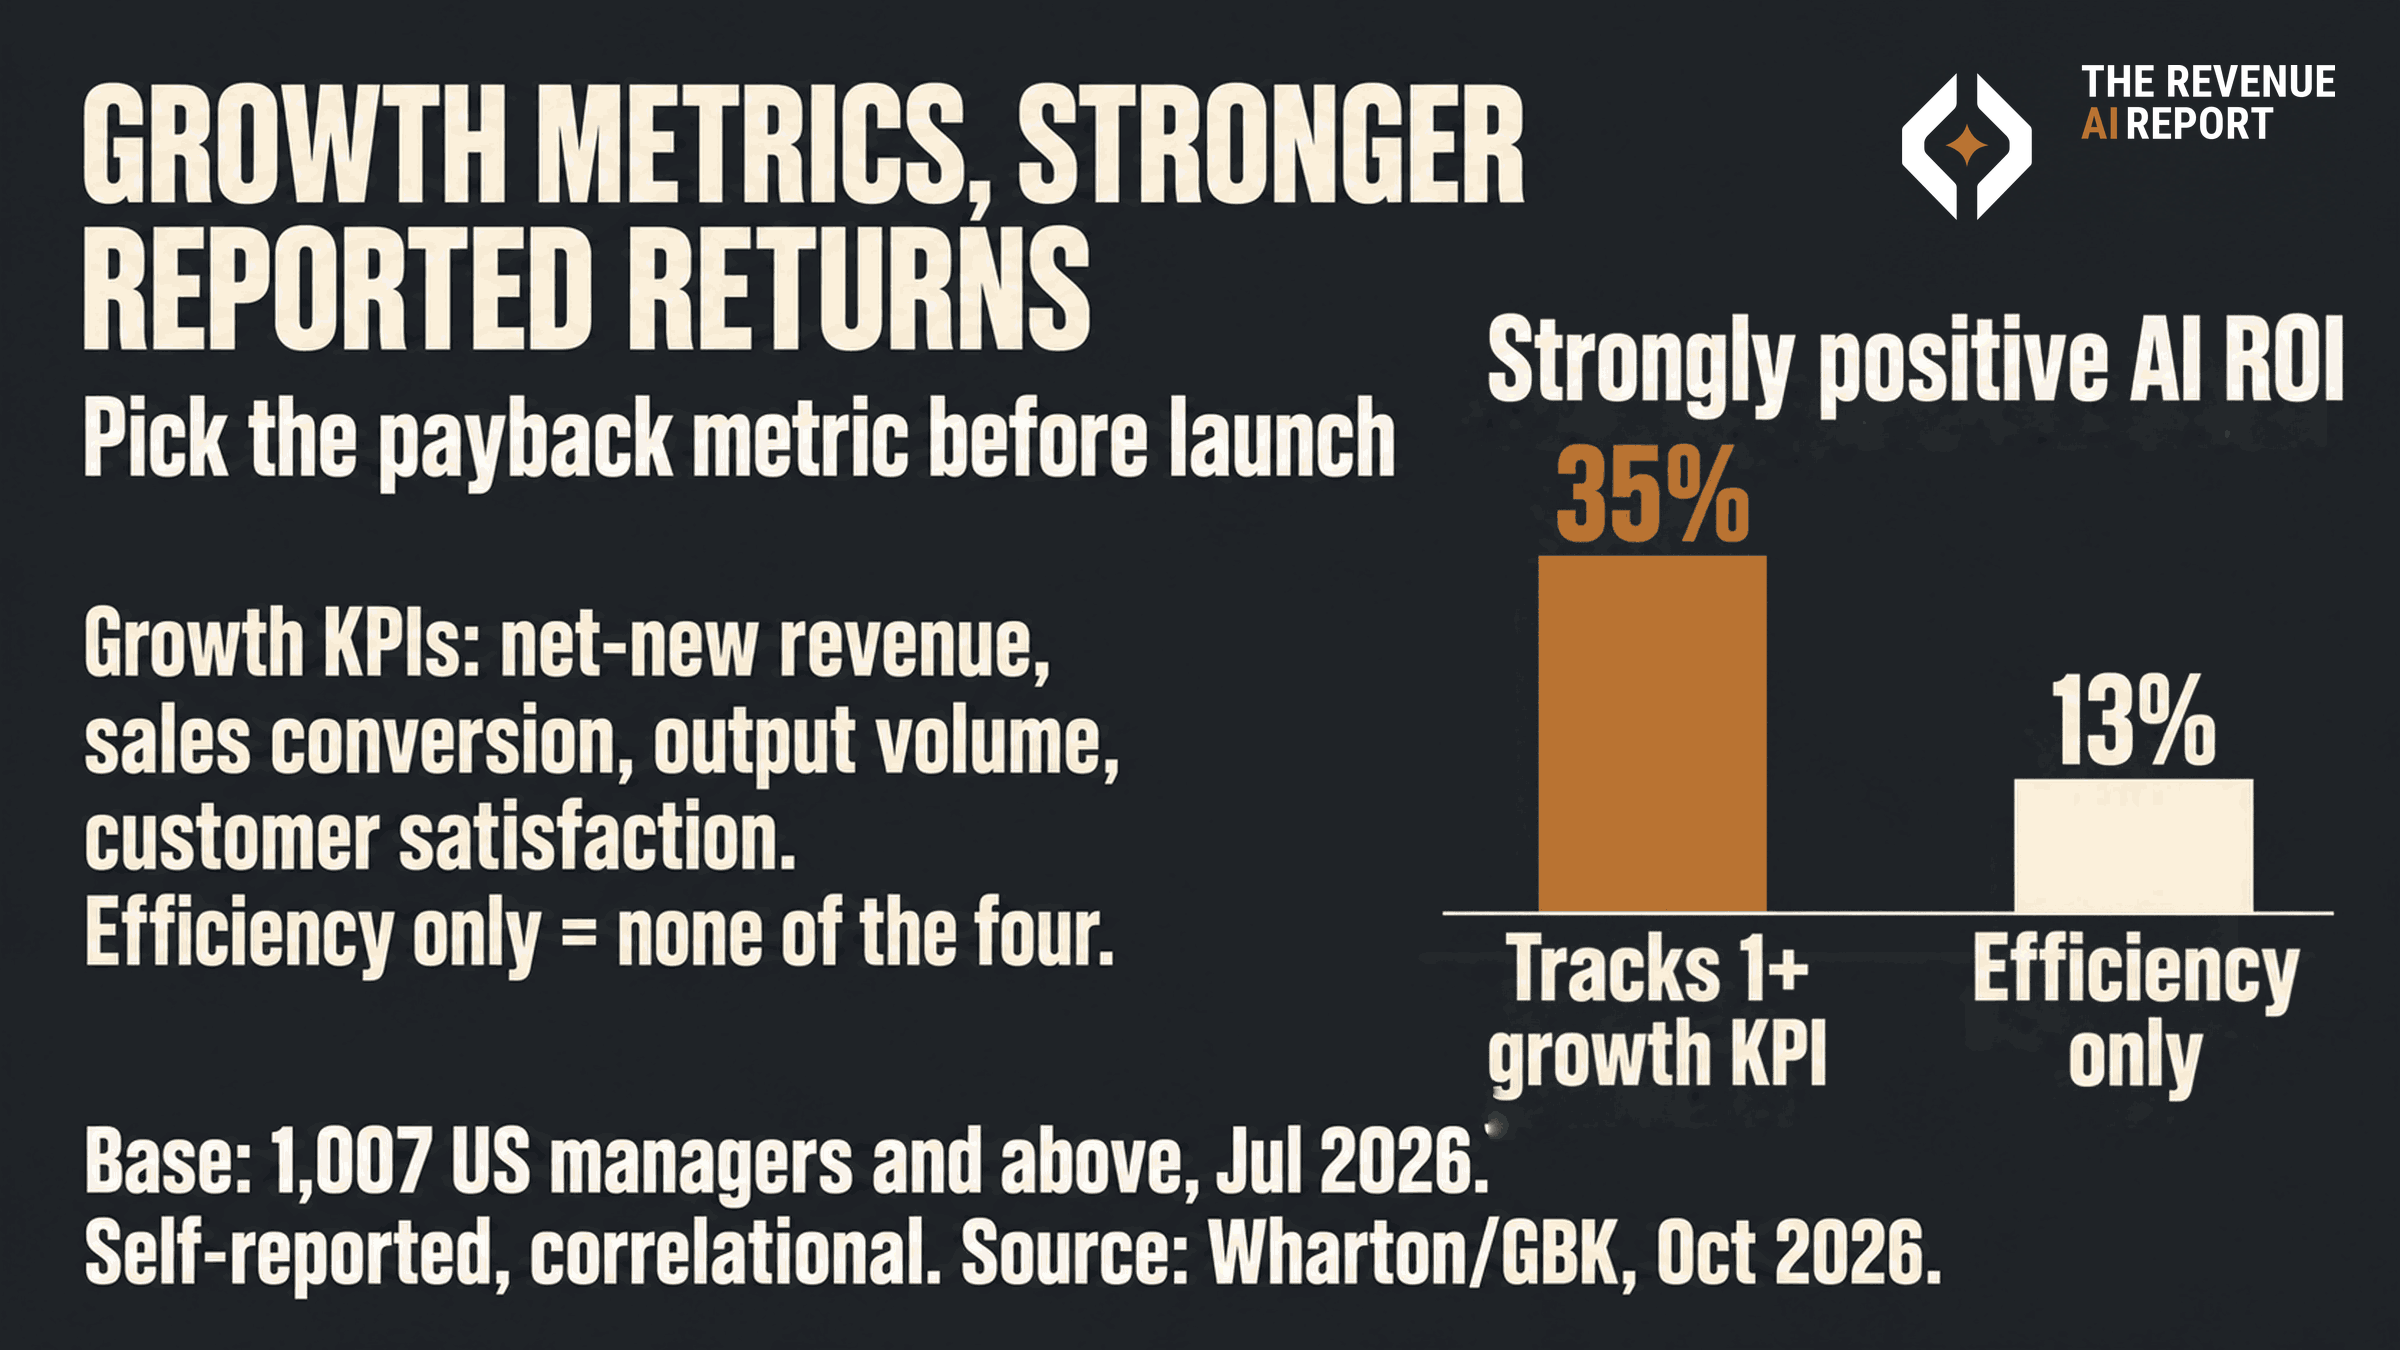
In Wharton/GBK's Oct 2026 survey, 35% of departments tracking a growth KPI report strongly positive AI returns, against 13% tracking efficiency alone. Choose the payback metric and a plan for freed hours at kickoff.
Jonathan Kvarfordt · Published October 17, 2026 · Last updated October 17, 2026 · 7 min read
Wharton/GBK found departments that track at least one growth KPI report strongly positive AI returns at 35%, against 13% for those tracking efficiency alone.
A team launches an AI project. A year later, finance asks whether it paid back. The team reaches for whatever it happened to measure, such as hours saved, and the answer lands soft. Nobody chose the payback metric at the start, so nobody planned for it.
A payback metric is the number you agree, before launch, will prove the project earned its cost. It comes in two kinds. An efficiency metric counts inputs saved: hours, cost per task. A growth metric counts what the business gains, such as revenue or customer satisfaction. Survey data from 2026 links that choice to the returns teams report.
What the survey found
Wharton Human-AI Research and GBK Collective surveyed 1,416 people at US companies with 1,000 or more employees and more than $50 million in revenue, from July 9 to 29, 2026. The figures below come from the 1,007 respondents at manager level and above (Wharton/GBK, Oct 2026). All returns are self-reported.
Overall, 80% of managers and above report positive returns, and only 28% strongly positive.
The report counts four growth metrics, in its short form "net-new revenue, sales conversion, output volume, and customer satisfaction." A department counts as "efficiency only" when it tracks none of the four. Departments that judge AI on at least one growth KPI report strongly positive ROI at 35%, against 13% for efficiency-only departments.
Hours saved is the more common pick. "Among managers who measure AI ROI, hours saved is the most used measure (40%) and net-new revenue the least used of the major measures (27%) (Wharton/GBK, Oct 2026)."
The cost side shows a similar pattern, and the report attaches its own caveat: "56% of managers+ who are very confident their organization can track its total AI spend report strongly positive returns, against just 10% of those who are less confident. Those same respondents are also more enthusiastic about AI in general, so some of the difference may reflect conviction rather than capability."
Cost also ranks high among the barriers managers name. "The cost of tools, compute and licenses ties with AI performance issues as the most cited barrier to stronger AI returns (34% of managers and above), ahead of skills shortages (27%) (Wharton/GBK, Oct 2026)." McKinsey's 2026 survey (1,719 respondents, 97 nations, May 4 to June 8, 2026) found about 20% say AI operating costs, tokens included, constrained their AI use (McKinsey, Aug 2026).
Where saved hours go
BCG's 2026 data shows what happens to saved hours when nobody plans for them. Its survey of 11,749 workers in 14 markets found 42% of frontline regular users save a full workday or more per week, but 66% get little or no guidance on using that time and more than half don't redirect it to strategic work (BCG, Jun 2026).
McKinsey's company-level numbers show a similar gap. 80% of its respondents say AI improved their individual productivity. 37% attribute at least some EBIT impact to AI, flat against 2025, and about 6% qualify as high performers, with 5% or more of EBIT from AI.
Read as a role-mix question: AI takes over part of a role's tasks, and the hours it frees need a named destination, such as more client conversations, faster follow-up or a larger territory. If nobody names a destination, no metric is set up to pick those hours up.
Set the clock to match
By executives' own reports, AI payback runs longer than a typical tech investment. Deloitte's survey of 1,854 senior executives in Europe and the Middle East (August to September 2025) found most respondents report satisfactory ROI on a typical AI use case in 2 to 4 years, against the 7 to 12 months typical for tech investments. Only 6% saw payback under a year (Deloitte, Oct 2025). A growth metric chosen at kickoff gives each review date something to read.
Where this evidence stops
The 35% against 13% split is correlational. Teams that pick growth metrics may also pick better use cases, or simply feel better about AI, as Wharton/GBK says of its own spend-tracking result. Payroll records offer a harder outcome measure. An NBER working paper using Danish payroll records (Humlum and Vestergaard, revised October 2025) found precise null effects on earnings and recorded hours, "ruling out effects larger than 2% two years after the launch of ChatGPT" (NBER w33777). Bleaker survey readings exist as well. MIT Project NANDA's preliminary July 2025 report says 95% of organizations report zero return on GenAI, from 52 interviews and 153 conference survey responses (MIT NANDA, PDF mirror). An IBM vendor study of 2,000 CEOs (May 2025) found only 25% of AI initiatives delivered expected ROI (IBM, May 2025). The counter-view also has a fair point: growth metrics move for many reasons, so a team can claim credit for a good quarter it did not cause. That is why the kickoff card below names a comparison group.
Benchmark: the kickoff card
Write one card per AI use case before launch. Five lines:
- Growth metric. One of Wharton/GBK's four kinds: net-new revenue, sales conversion, output volume or customer satisfaction. Write the current baseline.
- Efficiency metric. Hours or cost per task, kept as the supporting number.
- Freed-hours plan. Name where the saved time goes, who decides, and how you will check it went there.
- Comparison. A team, region or period without the tool, so the growth metric has something to beat.
- Review dates. Months 6, 12 and 24, each with the reading you expect by then.
For how to report the results upward, see Reporting AI Impact to the Board. For what to prove before renewing a tool already in place, see Companies Are Pulling Back on AI.
Two composite examples outside software
These are composites built to show the card. Neither is a reported case.
A hotel group's group-sales team. AI drafts responses to meeting and event requests. The efficiency metric is hours per proposal. The growth metric is proposal-to-contract conversion, with last year's same season as the baseline and one property held out as the comparison. The freed-hours plan sends sellers to call planners who booked two or more years ago and went quiet. The director of sales checks call logs monthly.
A regional insurer's distribution team. AI prepares agency performance summaries before territory managers visit independent agents. The efficiency metric is prep time per visit. The growth metric is new policies written per appointed agency. Half the territories start first, and the other half serve as the comparison. The freed-hours plan adds one in-person agency visit per manager per week, and the distribution lead reviews visit counts at month 6.
What to do this week
Pick the AI use case with the next budget decision. Fill in the five lines. If the growth metric line is blank, write it before the project spends another dollar.
Related
- Companies Are Pulling Back on AI. What Revenue Leaders Should Prove First
- Reporting AI Impact to the Board: Four Rows per Workflow
Sources
- Wharton Human-AI Research and GBK Collective, "The Adaptive Advantage: Who's Winning With AI and How," Oct 2026. 1,416 US respondents at firms with 1,000+ employees and >$50M revenue (1,007 managers and above), Jul 9 to 29, 2026: knowledge.wharton.upenn.edu
- BCG, "AI at Work 2026," Jun 3, 2026. 11,749 workers, 14 markets: bcg.com
- McKinsey, "The state of AI in 2026: On the road to ROI," Aug 25, 2026. 1,719 respondents, 97 nations, May 4 to Jun 8, 2026, consultancy survey: mckinsey.com
- Deloitte, "AI ROI: The paradox of rising investment and elusive returns," Oct 22, 2025. 1,854 senior executives, 14 countries in Europe and the Middle East, Aug 15 to Sep 5, 2025: deloitte.com
- Humlum and Vestergaard, NBER Working Paper 33777, revised Oct 2025. Danish administrative payroll data: nber.org
- MIT Project NANDA, "The GenAI Divide: State of AI in Business 2025," Jul 2025, preliminary v0.1. 52 interviews, 153 conference survey responses: PDF mirror. MIT does not host the report; press coverage: Fortune, Aug 18, 2025
- IBM Institute for Business Value, CEO study, May 6, 2025. Vendor study, 2,000 CEOs: newsroom.ibm.com
Frequently asked questions
- What is a payback metric for an AI project?
- It is the number agreed before launch that will show the project earned its cost. It can be an efficiency metric, such as hours saved, or a growth metric, such as net-new revenue, sales conversion, output volume or customer satisfaction.
- Do teams that track growth KPIs report better AI returns?
- In Wharton/GBK's Oct 2026 survey, departments that judge AI on at least one growth KPI report strongly positive ROI at 35%, against 13% for efficiency-only departments. The link is correlational and self-reported.
- What do companies use to measure AI ROI?
- Among managers who measure AI ROI, hours saved is the most used measure (40%) and net-new revenue the least used of the major measures (27%) (Wharton/GBK, Oct 2026).
- How long does AI payback take?
- In Deloitte's 2025 survey of executives in Europe and the Middle East, most respondents report satisfactory ROI on a typical AI use case in 2 to 4 years. Only 6% saw payback under a year.
- Why do hours saved by AI not show up in results?
- BCG's 2026 survey found 42% of frontline regular users save a full workday or more per week, but 66% get little or no guidance on using that time. A written plan for the freed hours gives them a destination you can measure.
Hiring for revenue roles?
Post your sales, marketing, RevOps or enablement opening where revenue leaders read every week. One 30-day post is $199. Three featured posts are $299/mo.
Keep reading
Benchmark
Ask the Same AI the Same Question Twice. How Many Runs Before a Citation Shift Counts as Proof?
Require a run count plus a variance band before any vendor citation-share delta counts as a result.
Benchmark
Landbase GTMBench Put GTM-3 Omni Ahead. Blind-Test Your Own ICP Before You Buy
Treat vendor precision as a question generator. Buy only after a blind ICP test, judged by someone who does not sell the tool, tracked accepted rows to held meetings to pipeline to cost.